by Cody Dumont
June 11, 2014

The Securities and Exchange Commission’s (SEC) Office of Compliance Inspections and Examinations (OCIE) issued a Risk Alert describing their Cybersecurity Initiative. The SEC initiative focuses on what they define as the core components for ensuring thorough network environmental security. The SEC Risk Alert dashboard assists organizations in evaluating and improving their cybersecurity preparedness according to the standards found in Tenable’s SEC Risk Alert Reference Guide.
The SEC Risk alert has seven key requirements:
- Maintain accurate inventories
- Maintain knowledge of normal operations
- Discover vulnerabilities and track remediation progress
- Prevent unauthorized activity
- Monitor for malicious activity
- Monitor for data loss
- Measure compliance
The SEC Risk Alert dashboard assists organizations with achieving these goals. Tenable Security Center allows a single console to administer continuous active scanning, passive detection, vulnerability management, and compliance checking across an organization. Because Security Center is completely scalable and customizable, dashboards and reports can be fine-tuned to deliver the most advanced analysis of cybersecurity risks.
The vulnerability data components offer insight into which hosts can be exploited and which vulnerabilities pose the greatest current threat to organizational security. The compliance related components show how many hosts adhere to the standards with which the organization has agreed to comply. Compliance adherence insight enables management to understand whether the scope and breadth of the configuration meets their business needs. Lastly, the event trending data on this dashboard is aimed at informing managers how many new devices are connected on a regular basis. New device information helps managers comprehend the rate at which new hardware is being deployed over time.
This dashboard is available in the Security Center Feed, a comprehensive collection of dashboards, reports, Assurance Report Cards, and assets. The dashboard can be easily located in the Security Center Feed under the Discovery & Detection category. The dashboard requirements are:
- Security Center 5.5.x
- Nessus 8.5.1
- NNM 5.9.1
Tenable Security Center provides continuous network monitoring, vulnerability identification and security monitoring. Security Center is continuously updated with information about advanced threats, zero-day vulnerabilities and new types of regulatory compliance configuration audit files. Tenable constantly analyzes information from unique sensors, delivering continuous visibility and critical context, and enabling decisive action that transforms a security program from reactive to proactive. Active scanning periodically examines the applications on the systems, the running processes and services, web applications and configuration settings. Passive listening provides real-time discovery of vulnerabilities on operating systems, protocols, network services, wireless devices, web applications, and critical infrastructure. Security Center provides an organization with the most comprehensive view of the network and actionable information to support mitigation efforts and reduce cyber risk. Tenable enables powerful, yet non-disruptive, continuous monitoring that will provide organizations with the information needed to reduce risk within the enterprise.
Listed below are the included components:
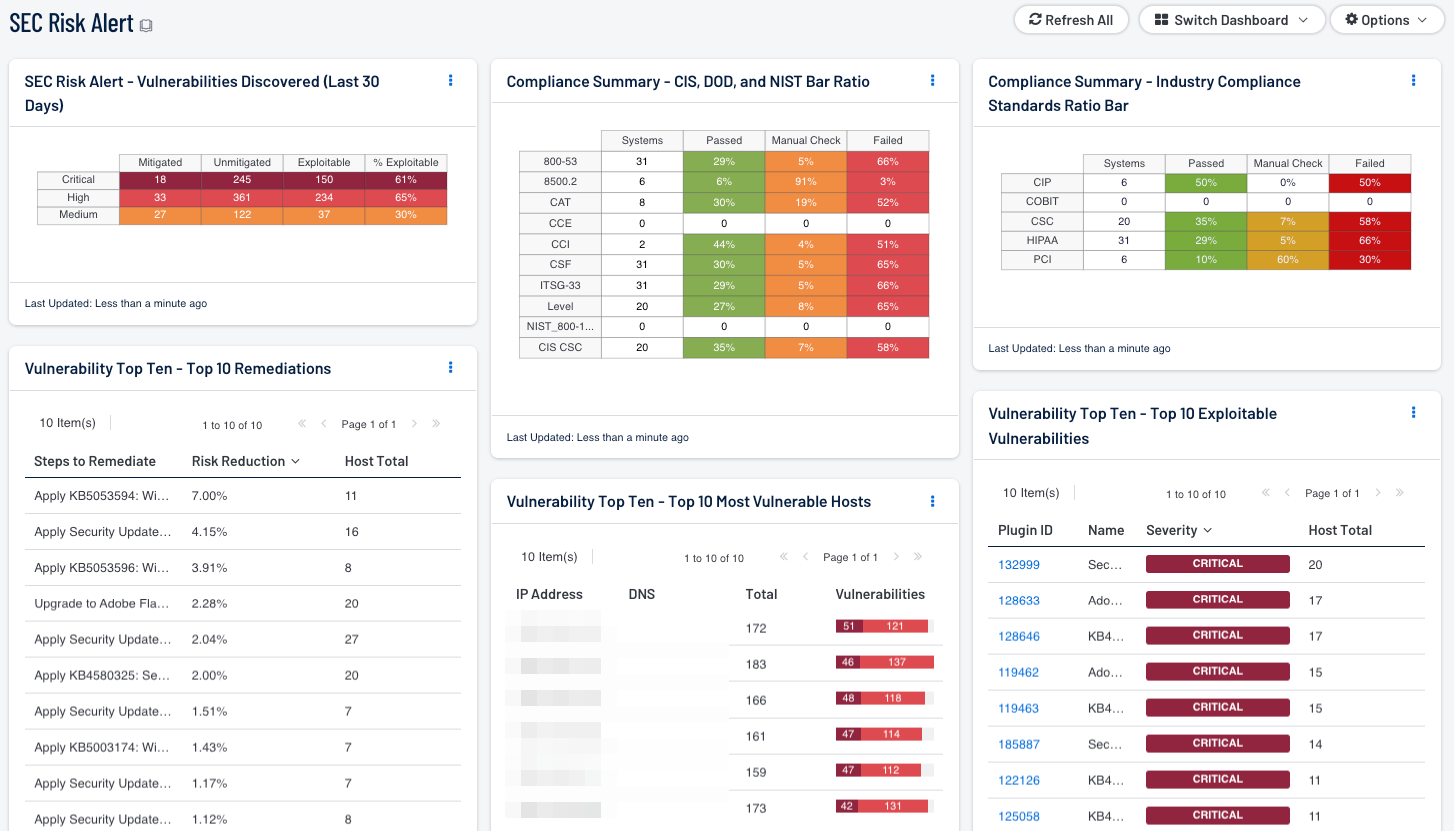
- Vulnerability Top Ten - Top 10 Remediations - This table displays the top 10 remediations for the network. For each remediation, the risk reduction for the network if the remediation is implemented is shown, along with the number of hosts affected. The list is sorted so that the highest risk reduction is at the top of the list. Implementing the remediations will decrease the vulnerability of the network.
- Vulnerability Top Ten - Top 10 Exploitable Vulnerabilities - This table displays the top 10 exploitable vulnerabilities on the network. The list is sorted so that the most critical vulnerability is at the top of the list. For each vulnerability, the severity and the number of hosts affected is shown.
- Vulnerability Top Ten - Top 10 Most Vulnerable Hosts - This table displays the 10 hosts on the network that have the greatest number of exploitable critical and high severity vulnerabilities. The list is sorted so that the most vulnerable host is at the top of the list. For each host, a bar graph of its critical and high severity vulnerabilities are shown.
- Vulnerabilities Discovered (Last 30 Days) - This component displays vulnerability tracking information for the last 30 days. Information on Critical, High, and Medium severity vulnerabilities discovered in the past 30 days is presented, including the number of vulnerabilities that have been mitigated, number of vulnerabilities still unmitigated, number of unmitigated vulnerabilities that are exploitable, and the percentage of unmitigated vulnerabilities that are exploitable. This information can assist in assessing how well cybersecurity vulnerabilities are being managed.
- Compliance Summary - Check Result Ratio - This component provides a ratio view of systems that have been checked for a variety of compliance standards. The ratio bar provides a visual of the number of compliance checks that have either passed, failed, or that require some manual verification.
- Industry Compliance Standards Ratio Bar - This matrix displays a summary of several audit standards related to industry standards, providing hosts count and ratio bars for each severity level.