by Cody Dumont
July 2, 2014

The Monetary Authority of Singapore(MAS) legislated the Technology Risk Management(TRM) guidelines for higher security in the financial industry. All financial institutions licensed, approved, or regulated by MAS must adhere to these guidelines to do business. This Dashboard provides information to assist teams in monitoring and reducing the cyber risk in their environment to comply with certain sections of the guidelines.
As financial institutions develop more online and mobile applications their attack surface and level of risk increases. The MAS TRM guidelines serve to assist financial institutions in managing their infrastructure and maximizing risk reduction. Security Center provides detailed information that benefit all infrastructure teams in an organization. The components in this dashboard assist with compliance of section 4 TRM Framework by providing risk identification, assessment, monitoring and reporting. Providing the top 10 exploitable vulnerabilities, most vulnerable hosts and remediation's assists analysts and administrators, to quickly identify and mitigate critical and high issues.
Administrators and analysts can identify and monitor a wide range of changes on the network with Nessus Network Monitor(NNM). Security Center provides managers with the ability to monitor the progress of mitigated and unmitigated assets and a view of all pass, fail or manual check for several standard compliance summaries. This information highlights areas of vulnerability on the network that may call for policy adjustments to better align with MAS TRM guidelines.
The dashboard and elements are available in the Security Center Feed, a comprehensive collection of dashboards, reports, assurance report cards and assets. The dashboard can be easily located in the Security Center Feed under the category Compliance & Configuration Assessments.
The dashboard requirements are:
- Security Center5.2.0
- Nessus 8.5.1
- NNM 5.9.0
Tenable Security Center provides continuous network monitoring, vulnerability identification and security monitoring. Security Center is continuously updated with information about advanced threats, zero-day vulnerabilities and new types of regulatory compliance configuration audit files. Tenable constantly analyzes information from unique sensors, delivering continuous visibility and critical context, and enabling decisive action that transforms a security program from reactive to proactive. Active scanning periodically examines the applications on the systems, the running processes and services, web applications and configuration settings. Passive listening provides real-time discovery of vulnerabilities on operating systems, protocols, network services, wireless devices, web applications, and critical infrastructure. Security Center provides an organization with the most comprehensive view of the network and actionable information to support mitigation efforts and reduce cyber risk. Teams can better monitor and asses their network with Security Center to be in compliancy with MAS TRM Guidelines. Tenable enables powerful, yet non-disruptive, continuous monitoring that will provide organizations with the information needed to reduce risk within the enterprise.
This dashboard contains the following components:
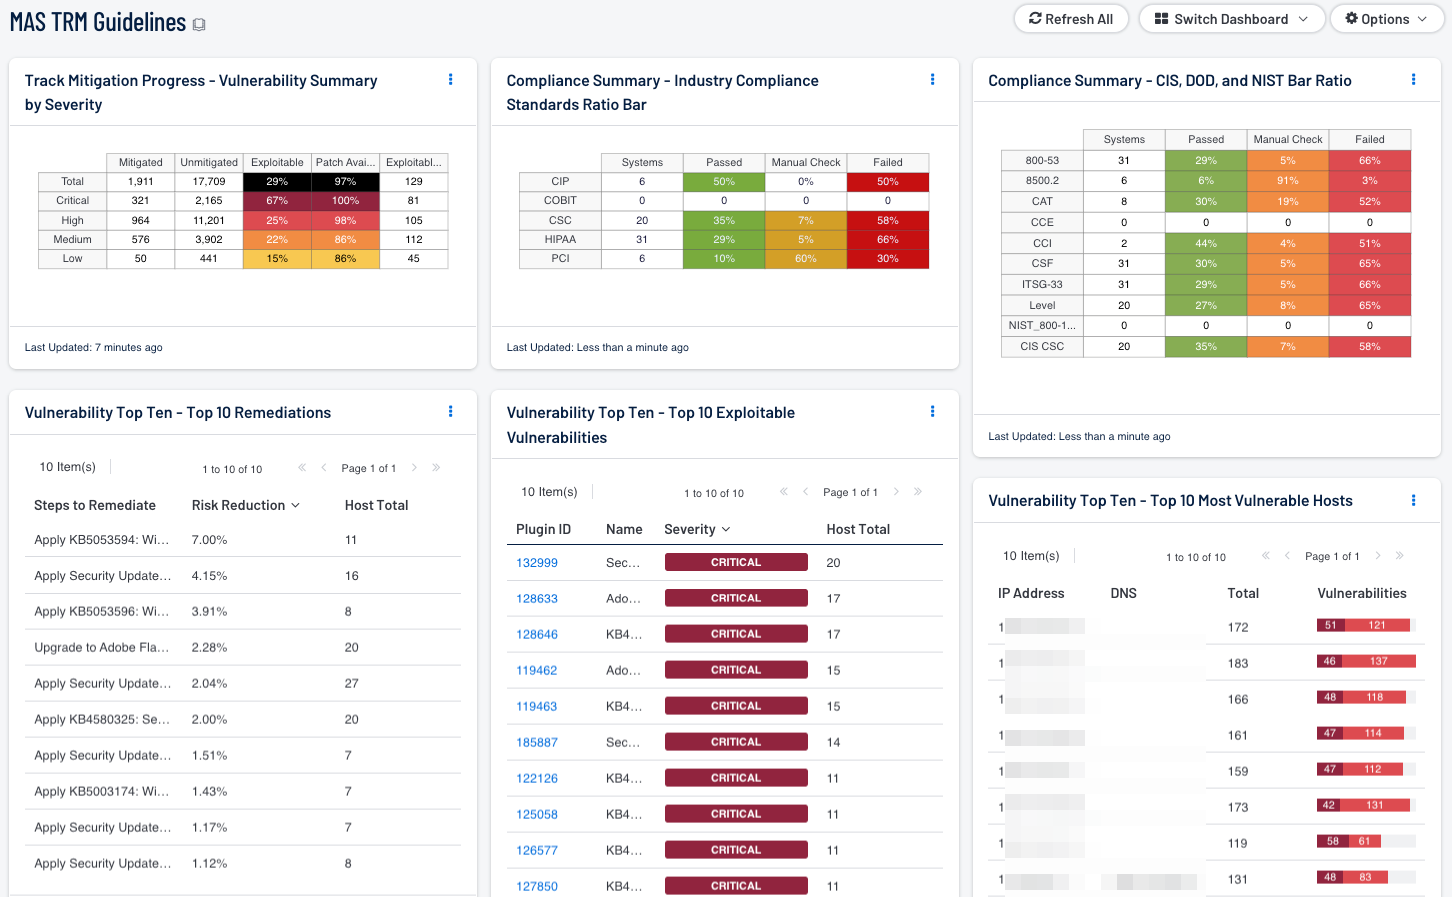
- Vulnerability Top Ten - Top 10 Remediations - This table displays the top 10 remediations for the network. For each remediation, the risk reduction for the network if the remediation is implemented is shown, along with the number of hosts affected. The list is sorted so that the highest risk reduction is at the top of the list. Implementing the remediations will decrease the vulnerability of the network.
- Vulnerability Top Ten - Top 10 Exploitable Vulnerabilities - This table displays the top 10 exploitable vulnerabilities on the network. The list is sorted so that the most critical vulnerability is at the top of the list. For each vulnerability, the severity and the number of hosts affected is shown.
- Vulnerability Top Ten - Top 10 Most Vulnerable Hosts - This table displays the 10 hosts on the network that have the greatest number of exploitable critical and high severity vulnerabilities. The list is sorted so that the most vulnerable host is at the top of the list. For each host, a bar graph of its critical and high severity vulnerabilities are shown.
- Track Mitigation Progress - Vulnerability Summary by Severity - Security Center records when vulnerabilities are discovered, when patches are issued, and when vulnerabilities are mitigated. This component assists in tracking vulnerability mitigations. The matrix presents vulnerability summary information by severity. In the matrix, the row with purple is critical severity vulnerability information, the row with red is high severity, the row with orange is medium severity, and the row with blue is low severity. The Mitigated column displays the total number of mitigated vulnerabilities. The Unmitigated column displays the total number of vulnerabilities that have not yet been mitigated. The Exploitable column displays the percentage of those unmitigated vulnerabilities that are known to be exploitable. The Patch Available column displays the percentage of the unmitigated, exploitable vulnerabilities that have had a patch available for more than 30 days. Ideally, both of these percentages should be 0%, because all exploitable vulnerabilities and all vulnerabilities with patches available should have been mitigated already. The Exploitable Hosts column displays the number of hosts on the network that have unmitigated, exploitable vulnerabilities.
- Compliance Summary - Check Result Ratio - This component provides a ratio view of systems that have been checked for a variety of compliance standards. The ratio bar provides a visual of the number of compliance checks that have either passed, failed, or that require some manual verification.