by Megan Daudelin
September 6, 2016

Monitoring enterprise management tools for vulnerabilities is essential to securing a network against exploitation. Enterprise management software is an essential part of managing and maintaining a secure network, but vulnerabilities in the tools can be catastrophic if exploited. By leveraging vulnerability data gathered by Tenable Nessus, Tenable SecurityCenter is able to provide detailed insight into vulnerabilities related to enterprise management tools deployed in an environment.
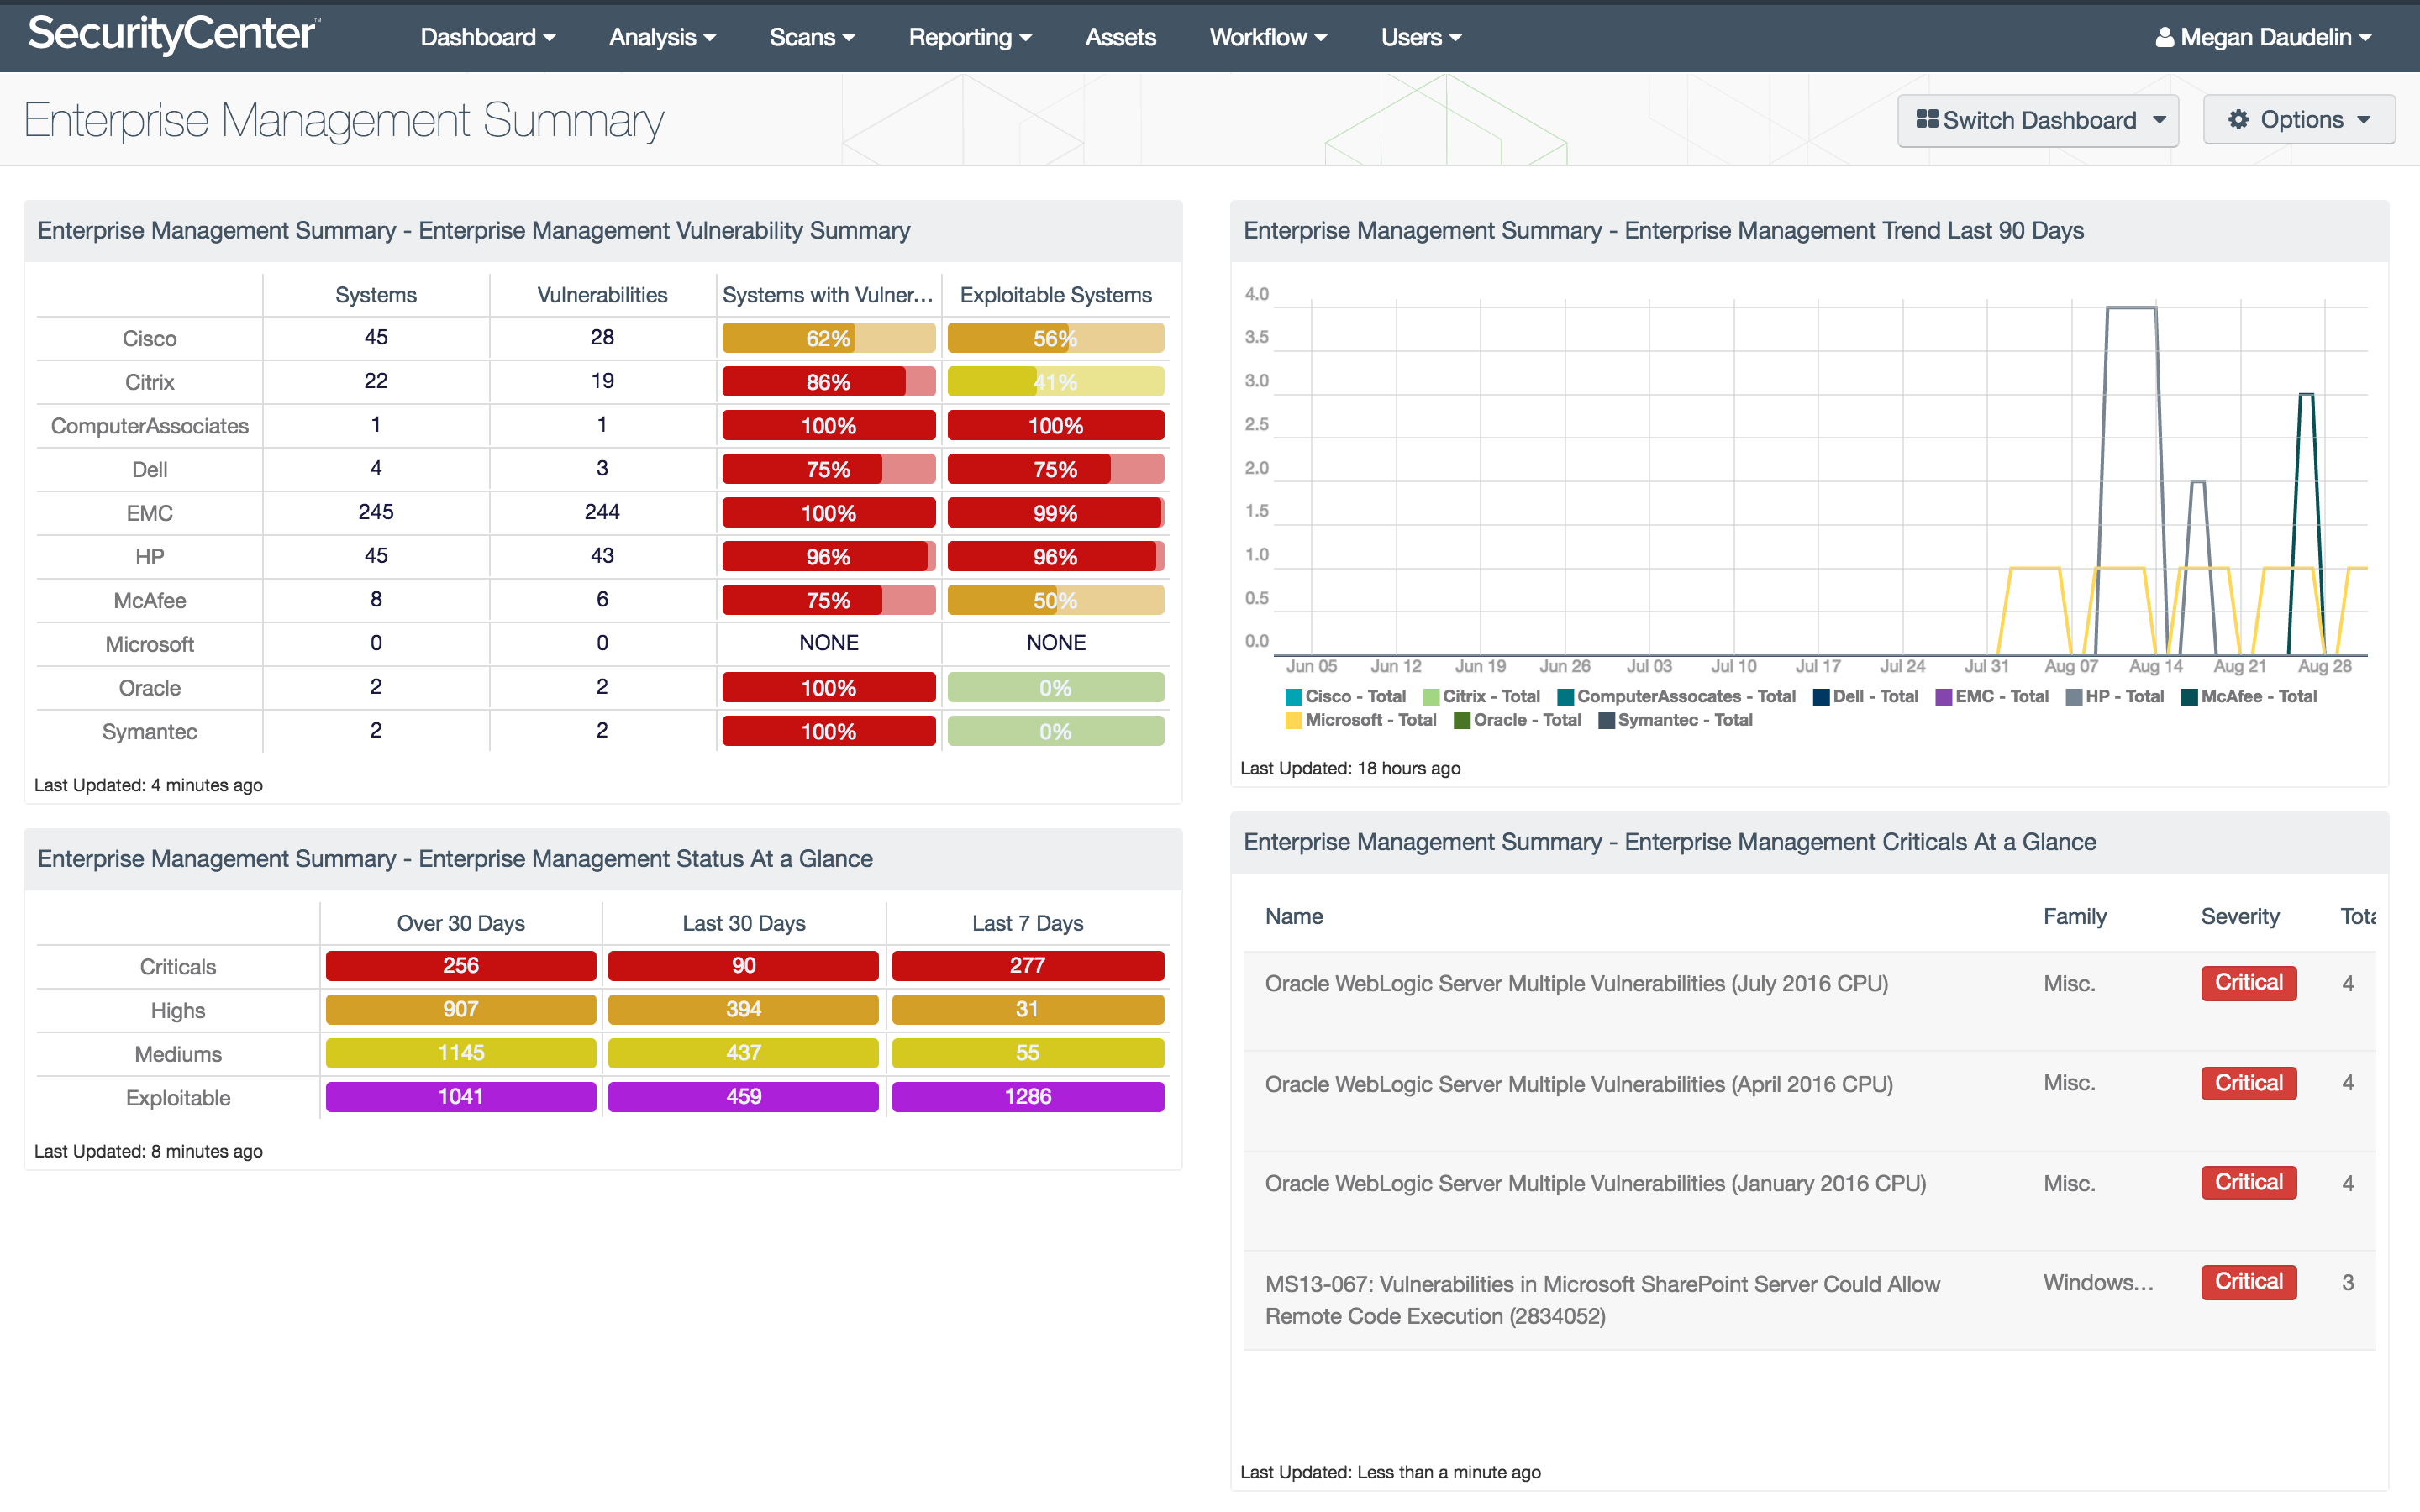
The Enterprise Management Summary dashboard provides insight into vulnerabilities associated with common enterprise management tools that may expose an organization to increased risk of exploitation. Vulnerabilities related to various types of enterprise management applications are specifically tracked. Enterprise management applications are a necessity for larger organizations, and as a result are often targeted for exploitation. By monitoring the network specifically for vulnerabilities in enterprise management tools, security teams can more effectively secure the network against exploitation and intrusion.
The components in this dashboard leverage data gathered by active vulnerability scanning with Nessus and passive vulnerability detection with Tenable Passive Vulnerability Scanner (PVS). The data collected is filtered to provide insight into the vulnerabilities related to enterprise management tools in the environment. Vulnerabilities are tracked by time, severity, and exploitability in order to provide a more complete view of the security status of the network. Security teams can use all of the components in this dashboard to assist in identifying, monitoring, and remediating vulnerabilities in enterprise management solutions that may expose their organization to risk.
The dashboard uses the Common Platform Enumeration (CPE) filter to identify many enterprise management tools. The CPE is used during software development as a way to identify unique applications and operating systems. According to NIST, the CPE is a structured naming scheme for information technology systems, software, and packages. Based upon the generic syntax for Uniform Resource Identifiers (URI), CPE includes a formal name format, a method for checking names against a system, and a description format for binding text and tests to a name. Tenable assigns CPE’s to plugins where appropriate. This allows for analysts to search for common CPE prefixes such as “cpe:/a:cisco:access,” “cpe:/a:hp:enterprise,” and “cpe:/a:sun:management_center.” Associating CPE strings with vulnerabilities allow the analysts a greater view into separating operating system vulnerabilities from application vulnerabilities, and adds to the level of a vulnerability detail provided to the organization.
This dashboard is available in the SecurityCenter Feed, a comprehensive collection of dashboards, reports, Assurance Report Cards, and assets. The dashboard can be easily located in the SecurityCenter Feed under the category Threat Detection & Vulnerability Assessments. The dashboard requirements are:
- SecurityCenter 5.3.1
- Nessus 6.8.1
Tenable SecurityCenter provides extensive network monitoring by leveraging a unique combination of detection, reporting, and pattern recognition utilizing industry recognized algorithms and models. SecurityCenter is continuously updated to detect advanced threats and vulnerabilities. Tenable constantly analyzes information from our unique sensors, delivering continuous visibility and critical context and enabling decisive action that transforms the security program from reactive to proactive. Continuous vulnerability analysis enables security teams to more effectively tailor remediation efforts. Monitoring the network to ensure that all systems are secured against vulnerabilities is essential to ongoing security efforts. Tenable’s extensive network monitoring capabilities can verify that systems are successfully scanned regularly and secured against vulnerabilities, enabling ongoing improvements to an organization’s security posture.
The following components are included in this dashboard:
- Enterprise Management Status at a Glance: This matrix displays the counts of vulnerabilities related to enterprise management tools by severity and discovery date. Counts are provided for medium, high, and critical severity vulnerabilities, as well as exploitable vulnerabilities. Security teams can use this matrix to monitor the detection of vulnerabilities related to enterprise management solutions in their environment.
- Enterprise Management Trend (Last 90 Days): This trend line chart depicts the detection of vulnerabilities related to specific vendors of enterprise management tools over the last 90 days. Each line is filtered for medium, high, and critical severity vulnerabilities related to a specific vendor of enterprise management solutions. The data points are calculated every three days to provide the most accurate trend of vulnerabilities detected over time. Security teams can use this line chart to track the presence of various types of vulnerabilities in enterprise management tools over time.
- Enterprise Management Criticals at a Glance: This table lists the critical vulnerabilities related to enterprise management tools detected in the environment. Relevant vulnerabilities with a critical severity level are shown to focus on the vulnerabilities that present the highest level of risk to the organization. For each vulnerability, the plugin name, severity, and family are listed. Security teams can use this component to identify and remediate the highest risk vulnerabilities in enterprise management solutions.
- Enterprise Management Vulnerability Summary: This matrix displays information about the systems and vulnerabilities detected on the network, listed by enterprise management solution vendor. The counts of vulnerabilities and impacted systems are provided, along with percentages of systems with vulnerabilities and exploitable systems. The percentage bars are color-coded based on the percentage of systems that meet the specified filters. The bar turns green when less than 25% of systems meet the filter, yellow when 25-50% of systems do, orange when 50-75% of systems do, and red when more than 75% of systems do. Security teams can use this component to identify high-risk enterprise management solutions and the potentially impacted systems.