by Cody Dumont
November 6, 2014

As highly motivated cyber attackers target organizations, security professionals must be able to identify increasingly sophisticated attack techniques. SecurityCenter Continuous View (CV) can provide several methods to identify metrics used in the "Breaking Cyber Kill Chains". The “cyber kill chain®” is a model for framing an incident response/analysis capability that was developed by Lockheed Martin’s Computer Incident Response Team.
As Ron Gula describes in this blog post 'Identifying the Weakest Links in Cyber Kill Chains®', there are three metrics that are important to monitor to simplify breaking kill chains. These dashboards provide the ability for the security analysts to monitor the metrics for breaking cyber kill chains®. Listed below are the three metrics:
- The number of Internet facing computers/servers that are exploitable – Identify servers on the network perimeter, in the DMZ, or deployed deep in your network and Internet addressable. Audit for services that are exposed to the Internet via open ports where an attack path could jump into your internal network.
- The number of Internet browsing computers with exploitable clients – Identify all assets that connect externally to the Internet and the ports that are used. Identify specific client side applications such as Skype, Facebook, YouTube, etc. Alert on devices that browse the Internet with unsupported or outdated software.
- The number of internal trusted systems that have exploitable services – Detect clients that are trusted by specific servers or ports to identify the most important clients on your network. Then determine which of these trusted systems have exploitable security issues (e.g., publicly known exploits, critical vulnerabilities, outdated applications, unpatched clients, old antivirus software) and which connect to the Internet.
These dashboards require the use of combination assets. Combination assets allow the analysts to combine several different assets together to be evaluated as one asset. Asset lists can be created for various groupings of IP addresses. There are several types of assets supported, such as static assets (which are statically defined by the user), dynamic assets, combination assets, and others. Dynamic assets create a list of IP addresses based on particular criteria, such as install applications, traffic patterns, and other device behaviors. Using a combination several assets can be combined together with Boolean logic to create a more targeted asset. The example shown below is a combination asset after it was created:
Once the asset is created, the analysts can add the asset to the dashboard during the configuration of the of the dashboard. A detailed how-to guide is provided here Breaking Kill Chains.
The dashboard and its components are available in the SecurityCenter Feed, a comprehensive collection of dashboards, reports, assurance report cards and assets. The dashboard can be easily located in the SecurityCenter Feed under the category Security Industry Trends.
The dashboard requirements are:
- SecurityCenter 4.8.1
- Nessus 5.2.7
- PVS 4.0.2
SecurityCenter Continuous View (CV) can identify and measure an organization’s attack surface and provide the means to visualize and communicate metrics that matter to the business. By incorporating Nessus to actively detect vulnerabilities and identify assets, the organization can easily detect at-risk systems. When accompanied by the Passive Vulnerability Scanner (PVS) and the Log Correlation Engine (LCE), organizations can still detect vulnerabilities and other activity on the network when active scanning is not possible. The combined results allow the organization to establish true threat intelligence awareness and actionable remediation plans.
Dashboards
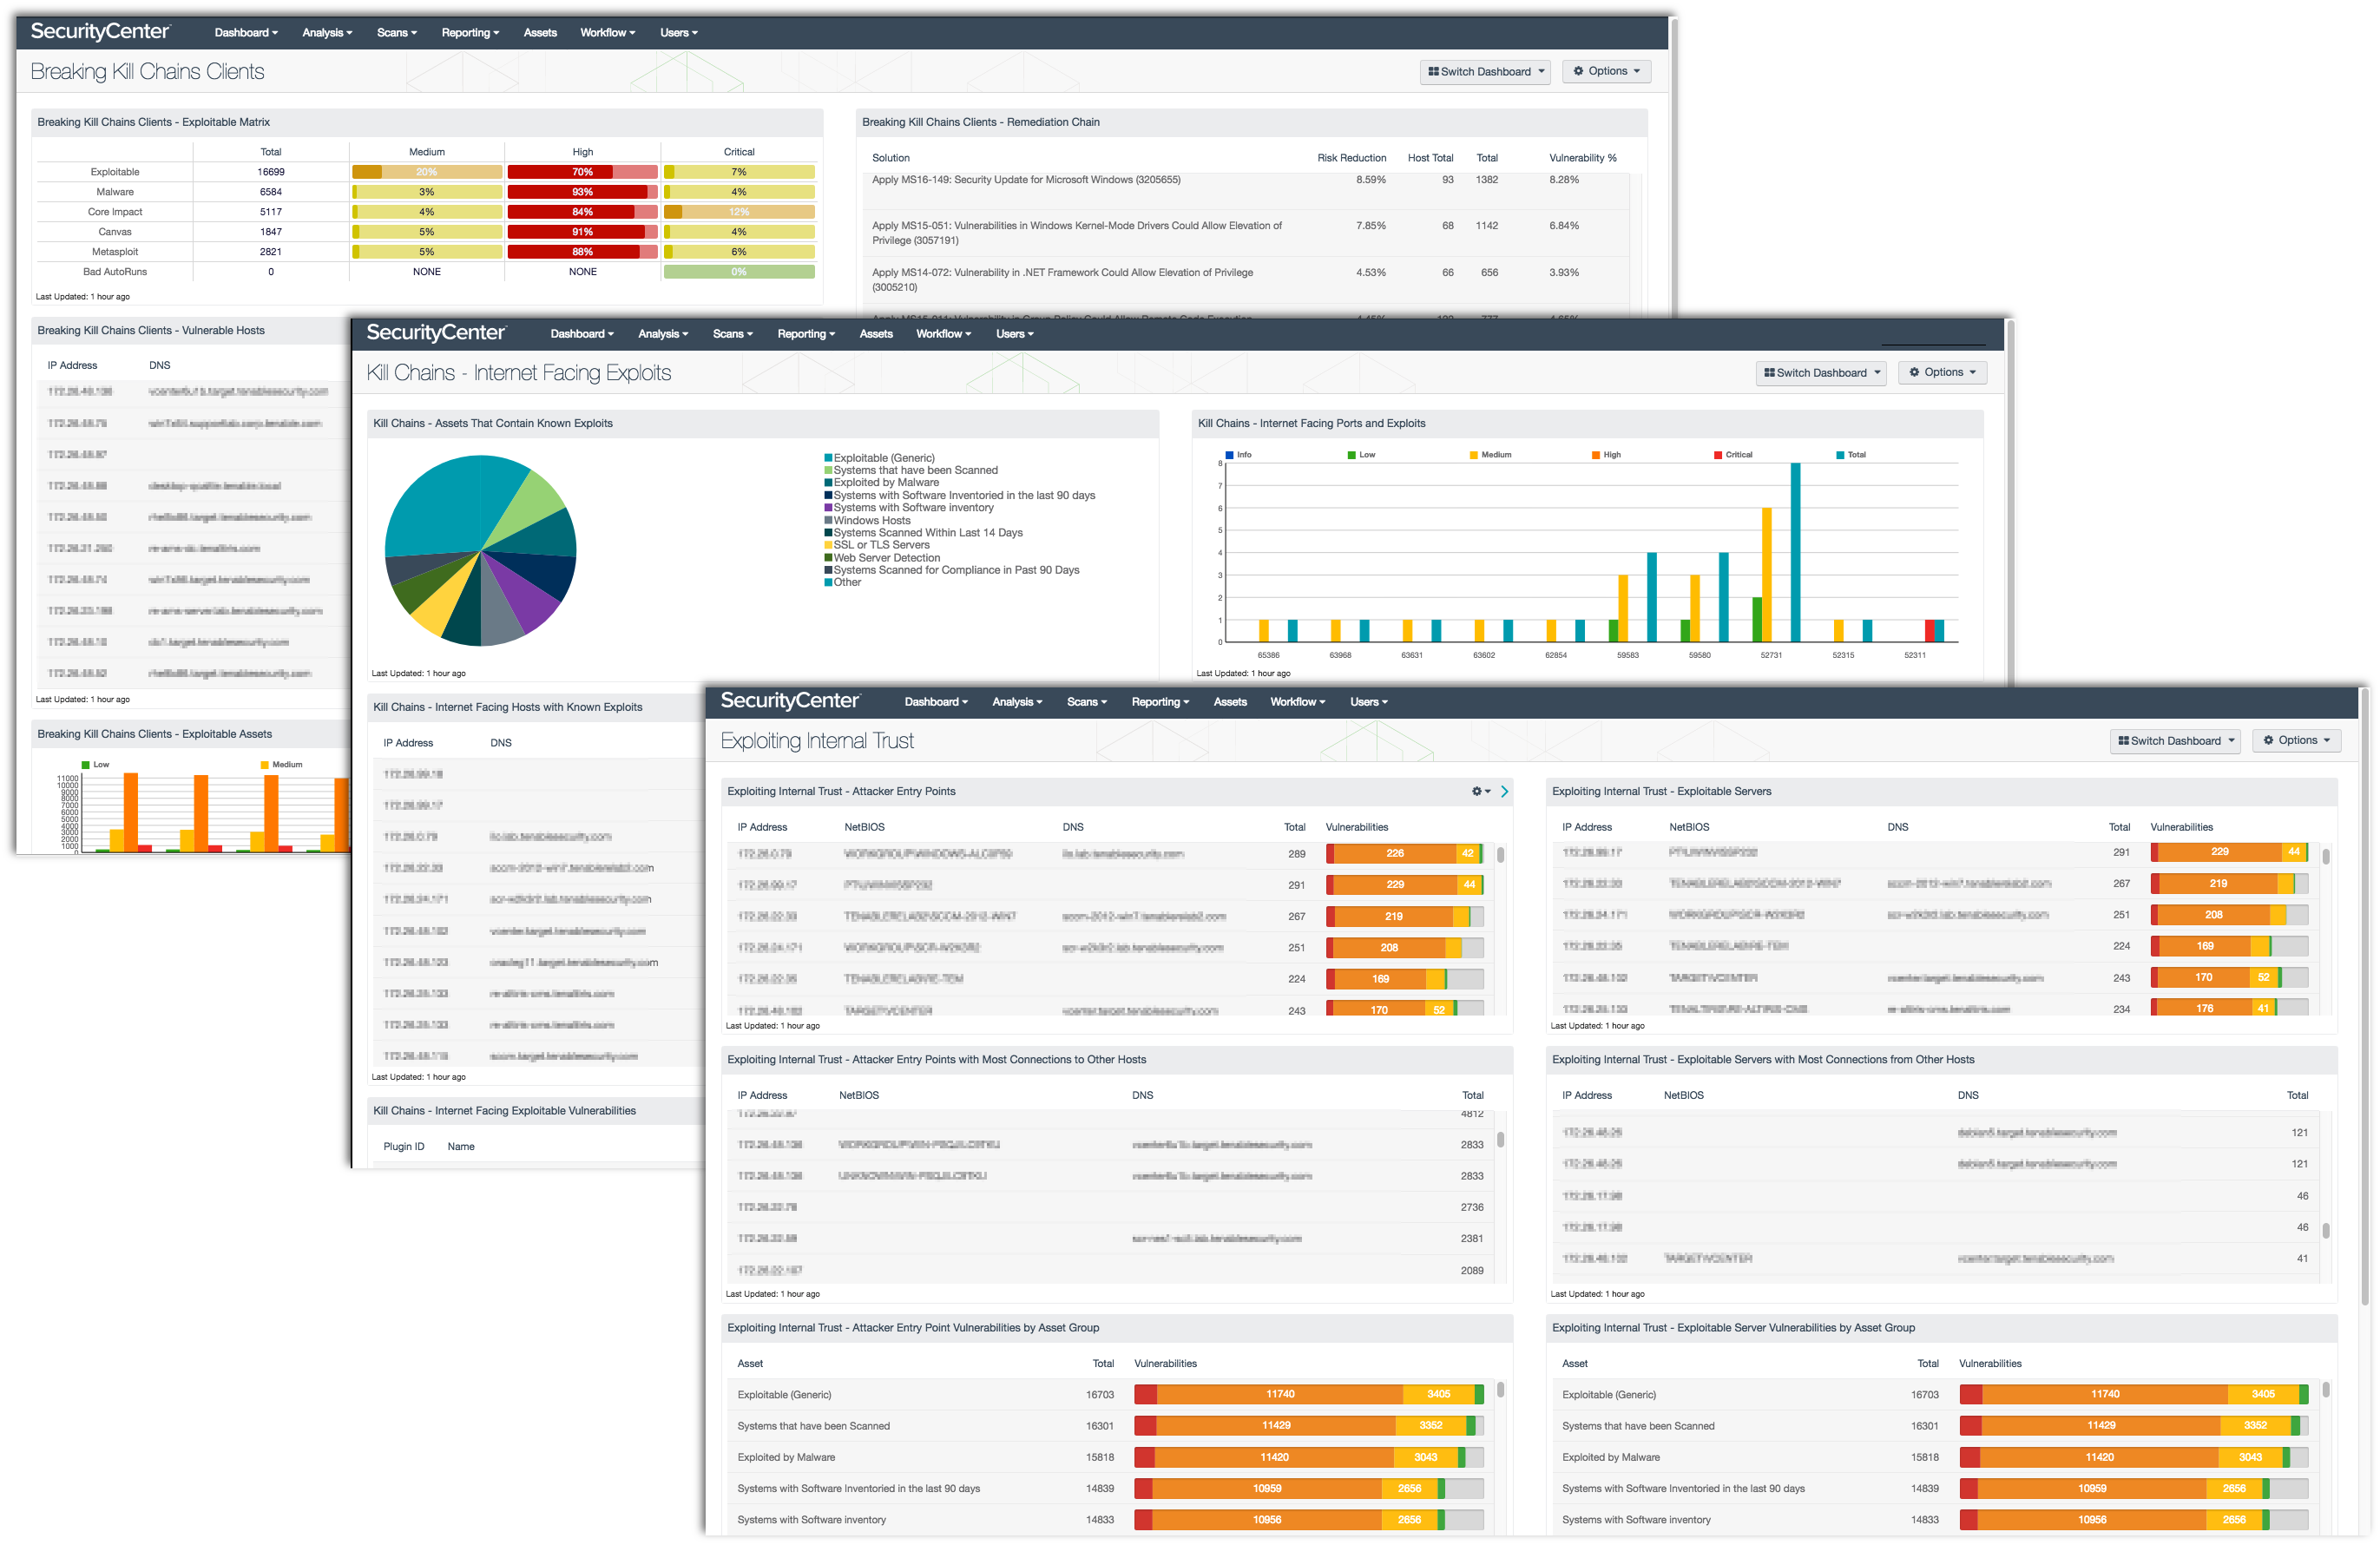
Kill Chains – Internet Facing Exploits: Internet-facing servers are popular attack targets. They are accessible to everyone on the Internet and can easily be probed for vulnerabilities. This collection presents the number of Internet facing computers/servers that are exploitable, and identifies servers on the network perimeter, in the DMZ, or deployed deep within the network that are Internet addressable. The data presented within the collection assists analysts in identifying and resolving exploitability concerns with Internet facing devices.
Breaking Kill Chains Clients: The number of Internet browsing computers with exploitable web clients is one of the metrics to monitor that identifies the weakest links in the network. Using CV, analysts can identify client machines that are the most vulnerable and most likely to be targeted by attackers.
Exploiting Internal Trust: Identifying exploitable systems is difficult enough without also tracking the systems to which they communicate. This dashboard presents two sets of components to aid in the monitoring of Attacker Entry Points and Exploitable Servers. Using CV, analysts can identify systems that are at risk of being entry points for attackers and the servers the systems communicate with.
