Event Analysis Training – Analyzing Blacklisted Web Traffic
Previously, we’ve blogged about the various advantages and disadvantages of using reputation based analysis of NetFlow, firewall and network sessions for event analysis. The basic concept is to use an external source of “badguy” IP addresses from commercial providers or free providers such as the SANS Internet Storm Center and see if any of your network IP addresses communicate with them.
If all you have is NetFlow or network session data
consisting of the IP addresses and ports, it can be difficult to analyze what
is being transmitted. Often, an IP address for something like a chat server
could be blacklisted, but that does not mean that every system making use of it
was involved in some sort of virus or botnet activity. The ability to see the
actual packet data or log of the HTTP message components such as the URI, web agent
and referrer in web-based attacks can mean the difference in responding to a possible
infection or safely ignoring an alert.
This blog describes how using real-time sniffed web transactions can be used to analyze “blacklisted” IP address connections.
Analyzing a Suspicious
Botnet Event
One of the sources of data that the Log Correlation Engine (LCE) can use for reputation based correlation are the block lists from the Emerging Threats set of Snort IDS rules.
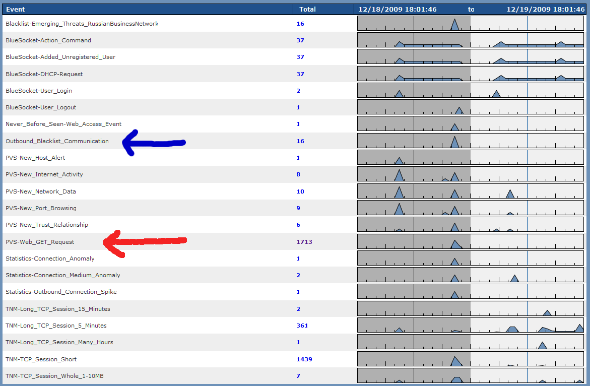
In the screenshot below (from a Security Center managing an LCE), there is an event named “Outbound Blacklisted Communication”, indicated with the blue arrow. This alert has occurred because the LCE received a sniffed network session where the destination IP address had been classified as part of the “Russian Business Network”. We took the source IP address in question and asked the LCE to graph out all activity detected and normalize events that are shown below.

This network is also being monitored with the Passive Vulnerability Scanner (PVS) and fortunately, it has been configured to passively sniff all unencrypted HTTP transactions. Several GET requests to many different sites were observed, including the potentially blacklisted site. These are indicated with the red arrow and marked as the “PVS-Web_GET_Request” event.
The ability to look into the 1713 GET requests helps us determine if this host is communicating with a botnet, receiving malicious commands or is perhaps simply browsing to a web site that is hosting normal content. Fortunately, in this case all of the web traffic observed by the PVS is legitimate. For example, the following is an example log generated from our host in question visiting the Mozilla.org web site:
<36>Dec
19 04:17:16 pvs: 10.30.248.165:1514|63.245.209.10:80|6|5266|Web
clients|GET{20}/includes/min/min.js?g=js_stats{20}HTTP/1.1{0d}{0a}Host:{20}en-us.www.mozilla.com{0d}{0a}User-Agent:{20}Mozilla/5.0{20}(Winvwdows;{20}U;{20}Windows{20}NT{20}5.1;{20}en-US;{20}rv:1.9.1.6){20}Gecko/20091201{20}Firefox/3.5.6{20}(.NET{20}CLR{20}3.5.30729){0d}{0a}Accept:{20}*/*{0d}{0a}Accept-Language:{20}en-us,en;q=0.5{0d}{0a}Accept-Encoding:{20}gzip,deflate{0d}{0a}Accept-Charset:{20}ISO-8859-1,utf-8;q=0.7,*;q=0.7{0d}{0a}Keep-Alive:{20}300{0d}{0a}Connection:{20}keep-alive{0d}{0a}Referer:{20}http://en-us.www.mozilla.com/en-US/firefox/3.5.6/whatsnew/{0d}{0a}{0d}{0a}|{01}{9b}{e9}M{b1}{97}{a2}){05}{10}{e1}{c5}{bb}I]{ce}59{d6}qE{9e}{dd}Jj|{ac}{95}*{1f}{9f}{b3}"J{bc}{18}{b1}O{8a}Lo{1d}~{83}{88}cMcK{e6}P+{f3}{04}{e9}{f5}{f5}{d3}6{b8}fY{a1}H{9c}{d8}`%{c6}!.^{9c}q{1a}{d3}e{bf}={20}{0f}{d5}{99}{90}h{aa}D}{f9}{b8}{96}{ae}{13}'{cb}j{f8}{bb}{0b}zG{9f}{c3}6{b7}{b8}S{98}{d1}{ec}b5V{e5}@{03}{e6}{8e}V{d8}{8f}{80}{e1}{bf}{18}{83}{ed}{f1}A{f8}l{e0}
The web traffic communicating with the specific IP address of the Russian Business Network was even less interesting. The target IP turned out to be part of a bittorrent service and each of the URLs searched for were simple GET requests for the main HTML of the site.
For this
example, even though there was a correlation with a known hostile IP address
with a bad reputation, the actual traffic was but potentially against corporate
policy.
Watching a Virus in Action
In this
example, we are looking at summaries from a small office that hosts some high
traffic video sites. Looking at the “blacklisted” hits for the past few days,
we can see that there has been near continuous outbound blacklist event
communications, as shown in the very last line in the graph below.

An analysis
of the IP addresses matching the 109 “Outbound Blacklist Communication” events shows
the overall events for each IP address on the list. One of the first IP
addresses we look at has the following pattern:

It is apparent that there is an immediate correlation between the “PVS Web GET Request” events and the “Outbound Blacklist Communication” events. There is no other web traffic. If the host in question were visiting cnn.com, shopping at eBay or browsing on Slashdot, we would still see the 15 outbound blacklist events, but there may be hundreds or thousands of “PVS Web GET Request” events. In this case though, solely based on the event frequency and counts, it looks like only web browsing activity on this host is virus related.
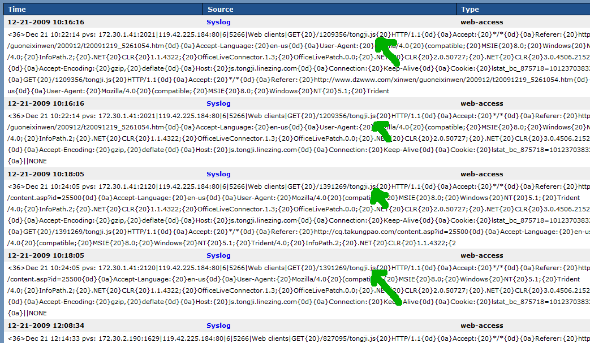
To confirm
this, we looked at the actual web logs as recorded by the PVS, shown in the
screenshot below:

Conclusion
Both of
these examples show how having access to the actual web traffic can help
determine if a set of blacklisted communications is a cause for alarm or could be
safely ignored. In our examples, we used web data obtained in real-time from
the PVS, but if we had access to web proxy logs, similar types of analysis
could be performed.
This blog is
a series in a set of posts that detail different forms of event analysis
techniques. We’ve blogged about new types of behaviors, statistical anomalies,
blacklist correlation and much more. These blog posts are an excellent source
of knowledge describing how to work with log analysis and anomaly detection.