COVID-19 Pandemic Data: As Attack Surface Expands, Software Vendors Improve Vulnerability Response Times

Tenable’s Zero-Day Research team found encouraging trends in how quickly software vendors are responding to our private disclosures, as well as how they’re addressing critical and high-severity vulnerabilities.
If someone told me at the start of the COVID-19 lockdown in March 2020 that software vendors would speed up the time they take to patch potential Zero Day* vulnerabilities, I would have chuckled and said it was wishful thinking. Clearly I was WRONG.
Tenable Research compared the number of patches issued by software vendors for critical and high-severity vulnerabilities in the first half of 2020 with the same periods in the prior four years. We also looked at the average response times to our own team’s Zero Day vulnerability disclosures in the first half of this year. In both cases, results are surprising. For example, in first-half 2020, the number of patches issued by software vendors for critical and high-severity vulnerabilities was about 25% higher than in first-half 2019. Likewise, we observed a dramatic reduction in the time it took vendors to respond to our own Zero Day disclosures.
What’s driving this increased activity? It’s difficult to prove empirically, but we believe the shift to work-from-home necessitated by the COVID-19 pandemic has not only led to a whole new set of challenges for employers worldwide, it has also created a breeding ground for cybercriminals looking to take advantage of the newly expanded attack surface. In this blog post, we explore key statistics related to vulnerability disclosure and patching in the first half of 2020, as well as how those efforts are helping to counteract these heightened threats.
Patches for Critical and High-Severity Vulnerabilities on the Rise
In first-half 2020, vendors patched 3,618 critical and high-severity vulnerabilities, a 25% increase over the 2,903 patched in first-half 2019. We chose to break the comparison out for the first-half of the year as this was our first foray into a large scale global event that is quite unprecedented in the last century.
In examining overall vulnerability trends from 2017 – 2019, we find that vendors patched, on average, 2,802 critical and high-severity vulnerabilities in the first half of each year (2,903 in first-half 2019; 3,095 in first-half 2018; and 2,409 in first-half 2017); looked at in this way, we find an approximately 30% increase in the number of critical and high-severity vulnerabilities patched in first-half 2020 compared with the first-half average of the three prior years.
The increase can be attributed, in part, to greater awareness all around. Year after year, we’ve seen more proactive findings as vendors adopt Secure Development Lifecycle best practices, more attackers look to exploit an expanding attack surface, and more researchers hunt for critical flaws, all of which result in an increase in the number of vulnerabilities reported.
Yet, we believe the increase in the first half of 2020 amounts to more than just a continuation of established trendlines. We believe the work-from-home policies enacted by organizations around the world in response to the global pandemic have vastly altered the attack surface. We’re seeing more endpoints outside the “perimeter,” more cloud infrastructure and applications being leveraged, more video conferencing and collaboration tools being embraced, more VPN servers in use, and more consumer-grade WiFi networks being put to use for business purposes, all in the interest of keeping organizations up and running while employees move to work from home.
If we extrapolate this data into a full-year projection for 2020, we believe vendors will likely patch at least 275 more critical and high-severity vulnerabilities this year than they did in full-year 2019. Despite the unique challenges of 2020, the number of critical and high-severity vulnerabilities that will be patched this year continues to grow.

The month of July, in particular, was what some might call “CVE season,” considering both the sheer number of patches issued for CVEs and the severity of them. Microsoft’s July Patch Tuesday included fixes for over 123 CVEs, while Oracle’s Quarterly Critical Patch Update in July included fixes for 284 CVEs.
If keeping up with the cadence of regularly scheduled patch updates from vendors like Microsoft and Oracle wasn’t enough, disclosures of high-severity vulnerabilities in networking solutions and web applications ensured that July 2020 was an exhausting month for defenders. At least five high-profile vulnerabilities received a CVSSv3 score of 10.0 in early July, including those in F5’s BIG-IP solution, SAP NetWeaver, Palo Alto Networks PAN-OS and Microsoft’s Windows DNS Server. In total, patches were issued for 753 critical and high-severity vulnerabilities in July.

A Closer Look at Zero-Day Response Times
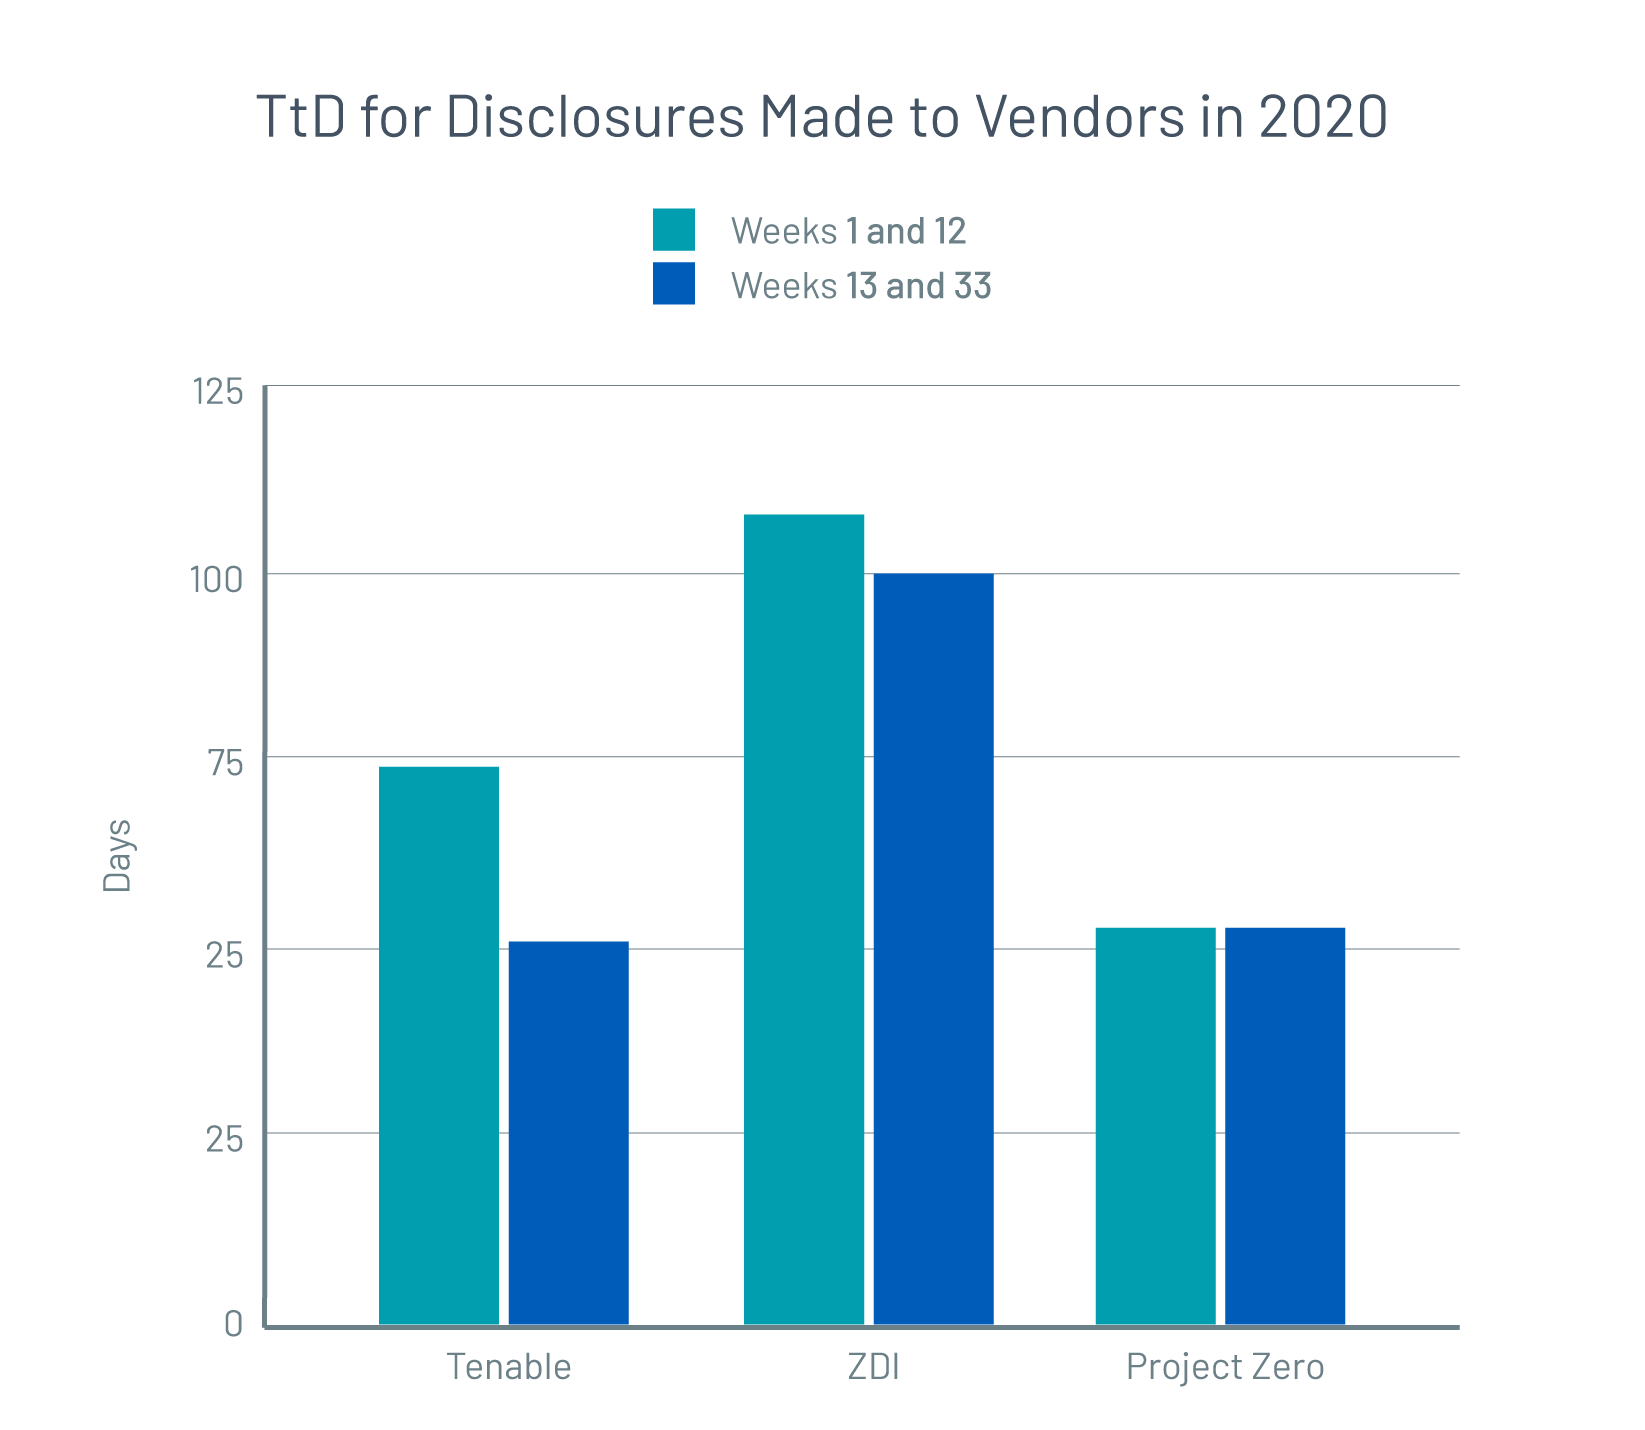
Tenable Research also examined two distinct blocks of time in 2020, revealing some key differences in Zero Day response activity as organizations around the world enacted their pandemic response strategies.
We compared the time to public disclosure (TtD) in weeks 1 – 12 of 2020 (roughly Jan. 1 through March 21, when widespread lockdowns were just starting to be enacted in many parts of the world) against weeks 13 – 33 (roughly March 22 through August 15, during which pandemic response strategies were fully enacted). In weeks 13 – 33, we found that TtD — the average time between our first contact with a vendor alerting them to a potential vulnerability and when the vendor released an updated version of their product containing a fix— was about 30% faster than in weeks 1 – 12.
And the increased speed isn’t due to a reduction in volume. Tenable Research disclosed 14 vulnerabilities in the first 12 weeks of 2020 compared with 27 in weeks 13 – 33 (roughly 15% more on a per week basis than the first time period). Weeks 34 onwards have intentionally not been considered for the scope of this blog post, even though the TtD is further lower for those weeks, as not all vulnerabilities reported to vendors have been patched yet or publicly disclosed.

In weeks 1 – 12 of 2020, the average time from our first contact to the vendor’s patch release was 72 days. As the global pandemic began to rage, many instances of the disclosure process were interrupted. However, the average TtD during this period saw a negligible increase. On the other hand, in weeks 13-33, TtD drastically declined to 51 days. Based on publicly available data from similar Zero Day programs, we observed similar trends, with response times holding steady or improving despite the unique challenges of 2020. We believe accelerating TtD benefits enterprise software users. Rapid turnaround from initial vendor contact to the release of a patch greatly aids vulnerability management efforts as it minimizes the time period during which a deployment is vulnerable to exploitation.
Given the ever-expanding attack surface, it is critical for organizations to identify potential cyberthreats and mitigate them quickly. The numbers presented here hopefully offer encouragement for researchers and vendors to work on coordinated disclosures, helping to elevate the security posture of the entire ecosystem. This process works best when security researchers and software vendors work together to release effective mitigation rather than stopping collaboration after a bug bounty has been fulfilled. Expediting the disclosure-to-patch process for any given Zero Day vulnerability will only become more crucial as more and more CVEs threaten increasingly distributed work environments.
Tenable’s Conor O’Neill, Pablo Ramos and James Sebree contributed to this report.
Learn more
- Catch up on our latest advisory, “Government Agencies Warn of State-Sponsored Actors Exploiting Publicly Known Vulnerabilities”
- Download the report, “Persistent Vulnerabilities: Their Causes and the Path Forward”
- Read the blog post, “Writing Security Advisories: 5 Best Practices For Vendors”
Methodology: The analysis in this blog post draws from Tenable's dataset of over 20 trillion aspects of threat, vulnerability and asset data, collected from over 10 different sources, including open-source, anonymized scan telemetry and commercial intelligence feeds. Data was sourced from the data lake for purposes of analysis.
Zero Day* data calculation: Only those vulnerabilities that have been disclosed to vendors in 2020 and also publicly disclosed either by Tenable’s Zero Day Research or similar programs as of November 20, 2020 have been considered in the data set. References include: Tenable Zero Day, ZDI, Project Zero (note: change in disclosure policy not accounted for as TtD didn’t change materially for the time periods considered)
*New vulnerabilities found by researchers and disclosed to vendors privately to enable coordinated disclosures
Criteria for data collection of critical and high severity vulnerabilities: Critical and High severity vulnerabilities published in the year where the CVE ID has the same year. Example: For 2020, all CVE IDs that start with CVE-2020-xxxx. Note: We do see similar results when we loosen the criteria above to include CVEs from previous years patched in the next year but for comparison purposes, since this data is not available for 2020 vulnerabilities that will be patched in 2021, we used the normalizing factor mentioned above to facilitate a more even comparison between the years. Sample NVD references: 2020 1H Critical, 2020 1H High, 2019 1H Critical, 2019 1H High
- Research Reports
- Vulnerability Management

