by Cody Dumont
December 9, 2014

Governance, Risk Management, and Compliance (GRC) is a substantial part of any information assurance program. A GRC program requires information systems to be audited, regardless of the standard to which the audit is performed. This dashboard provides the audit results for databases.
One of the initial steps in a successful GRC program is to set configuration guidelines and establish a supported set of security policies. Tenable.sc Continuous View (CV) can measure compliance using audit files that cover a wide range of major regulations and other auditable standards. Tenable provides over 500 audit files, which are available for download from the Tenable Support Portal, in categories such as operating systems, applications, databases, and network devices. Tenable products can be used to audit systems based on Security Content Automation Protocol (SCAP) content, and many Tenable audit policies have been certified by the Center for Internet Security (CIS). More information about audit files can be found in the Tenable Discussion Forums, Tenable Support Portal, Nessus Compliance Checks, and Nessus Compliance Reference.
The dashboard and its components are available in the Tenable.sc Feed, a comprehensive collection of dashboards, reports, assurance report cards and assets. The dashboard can be easily located in the Tenable.sc Feed under the category Compliance & Configuration Assessments.
The dashboard requirements are:
- Tenable.sc 4.8.1
- Nessus 5.2.7
- Database Compliance Data
Tenable.sc Continuous View (CV) using Nessus has the ability to access the Application Programming Interfaces (APIs) used to audit systems running Relational Database Management Systems (RDMS). Nessus implements various APIs used to audit database systems, such as Microsoft SQL Server, Oracle, MySQL, PostgreSQL, DB2, and Informix. The audit checks include password, remote access, separate partitions for database files, server memory settings, and SA account locked down.
Using an asset to identify specific systems running different RDMS can enhance this dashboard. An example of how to add an asset to a dashboard can be found in the following how-to guide: Using Assets with Dashboards How-To Guide.
Audit files can be customized to match the values defined by an organization’s corporate policies. Audit files are easily created or modified to support the organizations existing security policies. When an audit is performed, for each individual compliance check, Nessus attempts to determine if the host is compliant, non-compliant, or if the results are inconclusive and need to be verified manually. Unlike a vulnerability check that only reports if the vulnerability is actually present, a compliance check always reports a result. This way, the data can be used as the basis of an audit report to show that a host passed or failed a specific test, or if it could not be properly tested.
Tenable.sc CV is the market leader in providing a unique combination of vulnerability detection, compliance auditing, and reporting. Tenable.sc CV supports auditing more technologies than any other vendor, including operating systems, network devices, hypervisors, databases, tablets, phones, web servers, and critical infrastructure. Nessus is continuously updated with information about advanced threats and zero-day vulnerabilities, and new types of regulatory compliance configuration audits. This makes Tenable.sc CV the market-defining continuous network monitoring platform, and Nessus the market-defining vulnerability scanning for auditors and security analysts.
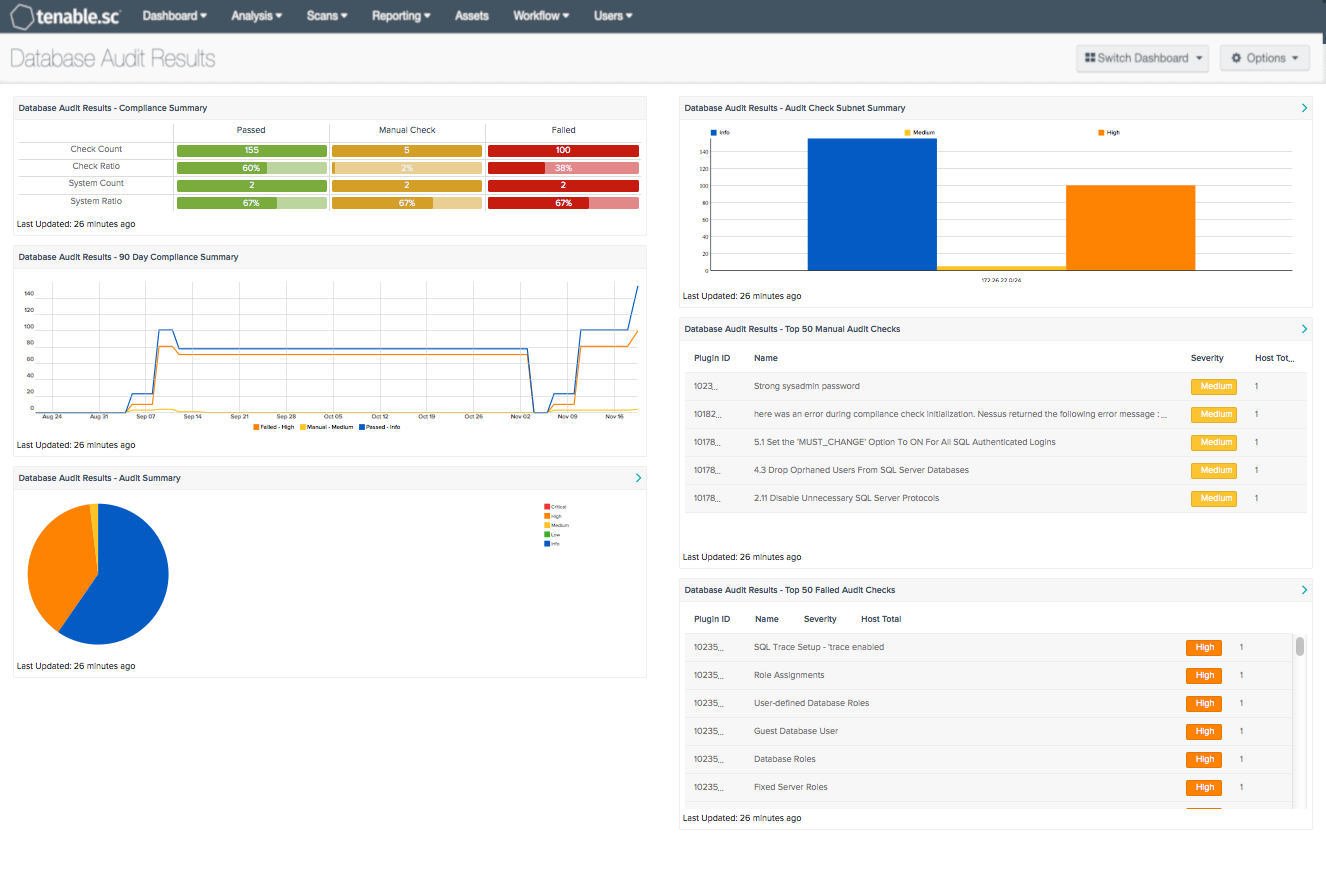
Database Audit Results - 90 Day Compliance Summary: The Database 90-Day Compliance Summary line chart provides analysts with a historic view of compliance status over the past 90 days. There are three lines on the graph: one each for passed checks, manual checks, and failed checks.
Database Audit Results - Audit Summary: The Database Audit Summary is a severity-based pie chart and helps to summarize the current compliance status. The chart provides a conceptual view of the compliance status. High severity denotes checks that have failed to meet the compliance threshold. Medium severity shows checks that need to be manually reviewed to assess their compliance state. Informational severity status is used for checks that have passed the compliance check.
Database Audit Results - Audit Check Subnet Summary: The Database Audit Check Subnet Summary chart provides a summary of the top 30 affected subnets. The columns are sorted using the failed compliance check (vulnerability) count column. The audit checks return 1 of 3 values: Info severity represents passed checks, High severity represents failed audit checks, and Medium severity represents checks that must be manually verified.
Database Audit Results - Top 50 Manual Audit Checks: The Database Top 50 Manual Audit Host Details table is an informative table providing the most common audit checks that need to be manually verified.
Database Audit Results - Top 50 Failed Audit Checks: The Database Top 50 Failed Audit Host Details table is an informative table providing the audit checks that have failed the audit check.