by Michael Willison
February 19, 2015

Applications running on Windows systems that continuously crash or hang can be difficult to identify . Hangs and crashes can be the result of hardware, software, or malware issues. SecurityCenter Continuous View (CV) can monitor and report termination, hang, fault, and failure process events.
This dashboard detects Windows application abnormal terminations, hangs, faults, failed processes, and summarizes Windows crashes. A crash occurs when a software application or an operating system stops functioning properly. Application crashes are caused from software that stops responding due to a buffer overflow, segmented fault, attempting to execute privileged code, or passing invalid augments to system calls. Other causes of crashes can include accessing other system resources, to which the application does not have permission to access, and executing machine instructions with bad arguments, also causes these faults. Software crashes can be exploitable, due to the resulting buffer overflow or segmentation faults.
The dashboard and its components are available in the SecurityCenter Feed, a comprehensive collection of dashboards, reports, assurance report cards and assets. The dashboard can be easily located in the SecurityCenter Feed under the category Discovery & Detection.
The dashboard requirements are:
- SecurityCenter 4.7
- LCE 4.4.1
- Log Correlation Engine Client 4.4.0 for Windows
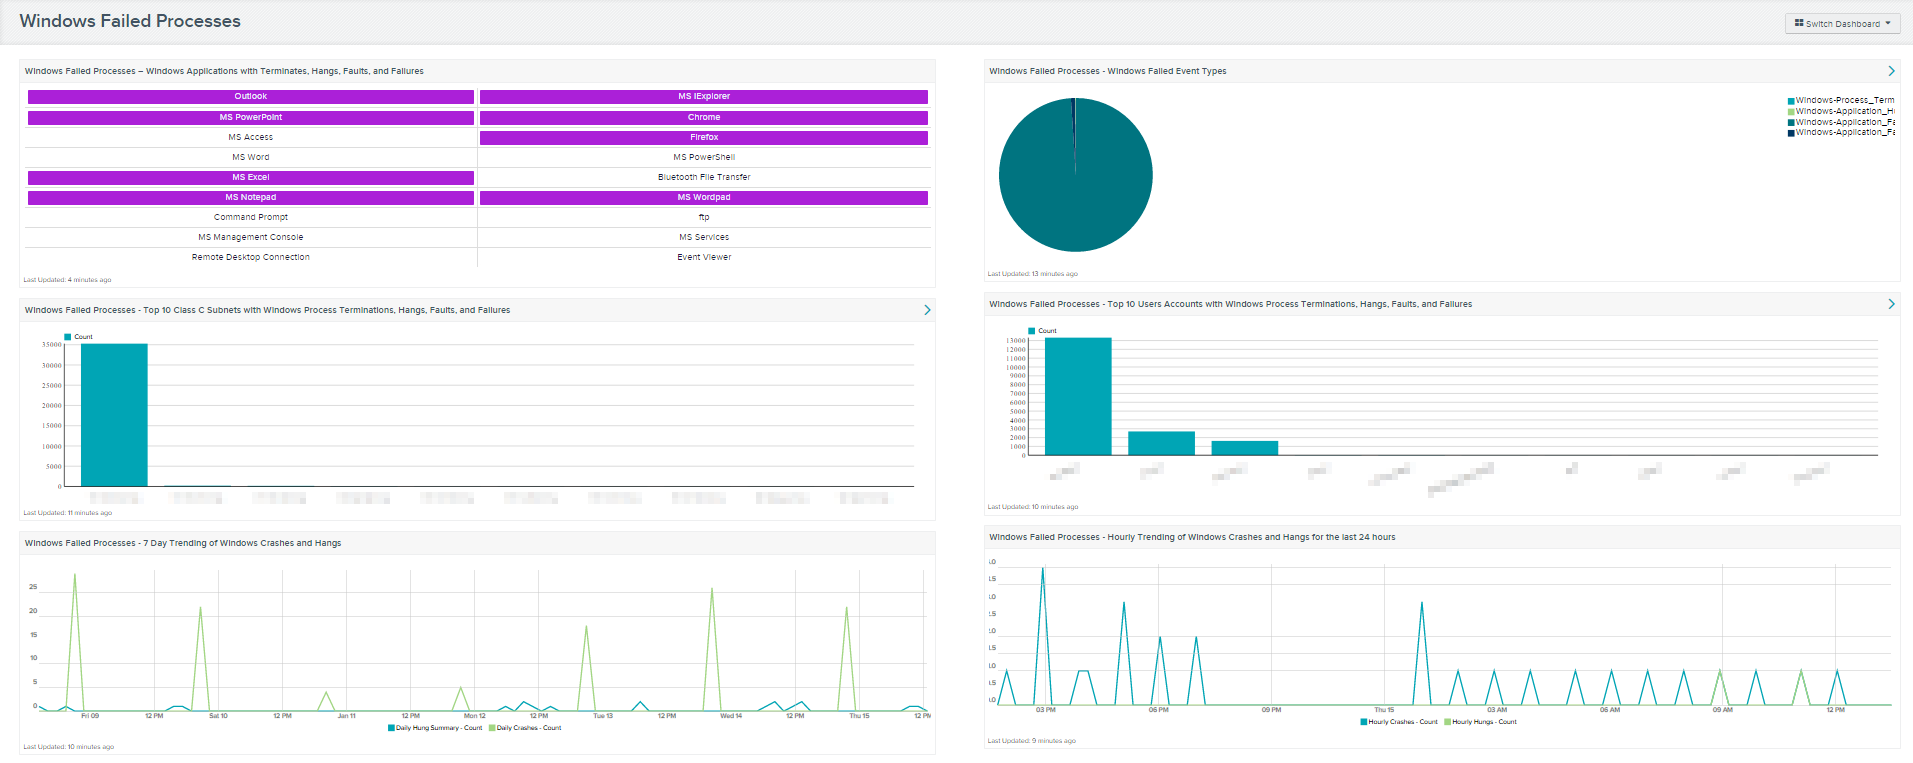
This dashboard will provide information about Windows application terminations, hangs, faults, and/or failed processes have occurred during the last 72 hours, the subnets these events have occurred on, and the user accounts that are most affected by said events.
SecurityCenter Continuous View (CV) provides continuous network monitoring, identifies vulnerabilities, helps reduce risk, and monitors for compliance. The Log Correlation Engine (LCE) performs deep log analysis and correlation to continuously discover and track users, applications, cloud infrastructure, trust relationships, and vulnerabilities.
The collection contains the following components:
- Windows Failed Processes – Windows Applications with Terminates, Hangs, Faults, and Failures: Common Windows application processes make up this matrix component. Each indicator represents a Windows application termination, hang, fault, and/or failed process. When a match is found, the indicator turns purple. Clicking on the indicator provides the analyst with additional event details. This matrix component uses filters for keyword and process type events, to present event data.
- Windows Failed Processes - Windows Failed Event Types: This pie chart presents a graphical representation of Windows applications with terminations, hangs, faults, and/or failed processes. The chart is sorted in descending order to display the events that are occurring the most.
- Windows Failed Processes - Top 10 Class C Subnets with Windows Process Terminations, Hangs, Faults, and Failures: This table provides a summary of the top 10 affected subnets with Windows application terminations, hangs, faults, and/or failed processes. Each bar represents the total number of events present within a class C subnet. The table shows the top 10 class C subnets sorted by event count and in descending order. To view event detailed information click on the Browse Component Data button and change the tool to Raw Syslog Events to view syslog events.
- Windows Failed Processes - Top 10 Users Accounts with Windows Process Terminations, Hangs, Faults, and Failures: This table identifies user accounts with the most Windows applications terminations, hangs, faults, and/or failed processes for the last 72 hours. The top 10 accounts are sorted by event count in descending order. Clicking the Browse Component Data button and selecting the desired user can obtain detailed user account information. Changing the tool to Raw Syslog Events while in this view provides the analyst with additional details from raw syslog events.
- Windows Failed Processes - 7 Day Trending of Windows Crashes and Hangs: This chart displays a daily trend of Windows crashes and hangs for the last seven days. The Log Correlation Engine (LCE) summarizes all Window hangs and crashes sent from the Windows LCE clients. Each data point represents a day within this trending chart. This chart will assist an analyst to determine when Windows crashes and hangs have occurred during the last seven days. If Windows crashes and hangs are reoccurring daily, then the data could indicate a risk or threat is attempting to attack systems on the network.
-
Windows Failed Processes - Hourly Trending of Windows Crashes and Hangs for the last 24 hours: This component displays an hourly trending of Windows crashes and hangs for the last 24 hours. Each data point represents 1hour in a 24-hour duration. Windows systems with LCE clients installed send application events to LCE. LCE summarizes this data into normalized events. By providing hourly trending data on the application crashes or hung processes, an analyst has a clearer insight to when these events occur.This chart will assist an analyst to determine when Windows crashes and hangs have occurred during the day. If these Window system crashes and hangs are happening after hours. This data could indicate a risk or threat is attempting to attack a system on the network.
Note: By default, the Update Frequency setting is set for daily updates. This needs to be change to hourly to have this component work properly.