by Megan Daudelin
July 17, 2015

Analyzing virus trending can assist a security team in containing a cyber attack on the network. The Log Correlation Engine (LCE) normalizes logs from many different types of antivirus technologies. SecurityCenter Continuous View (CV) has the ability to monitor virus-related events detected by the LCE.
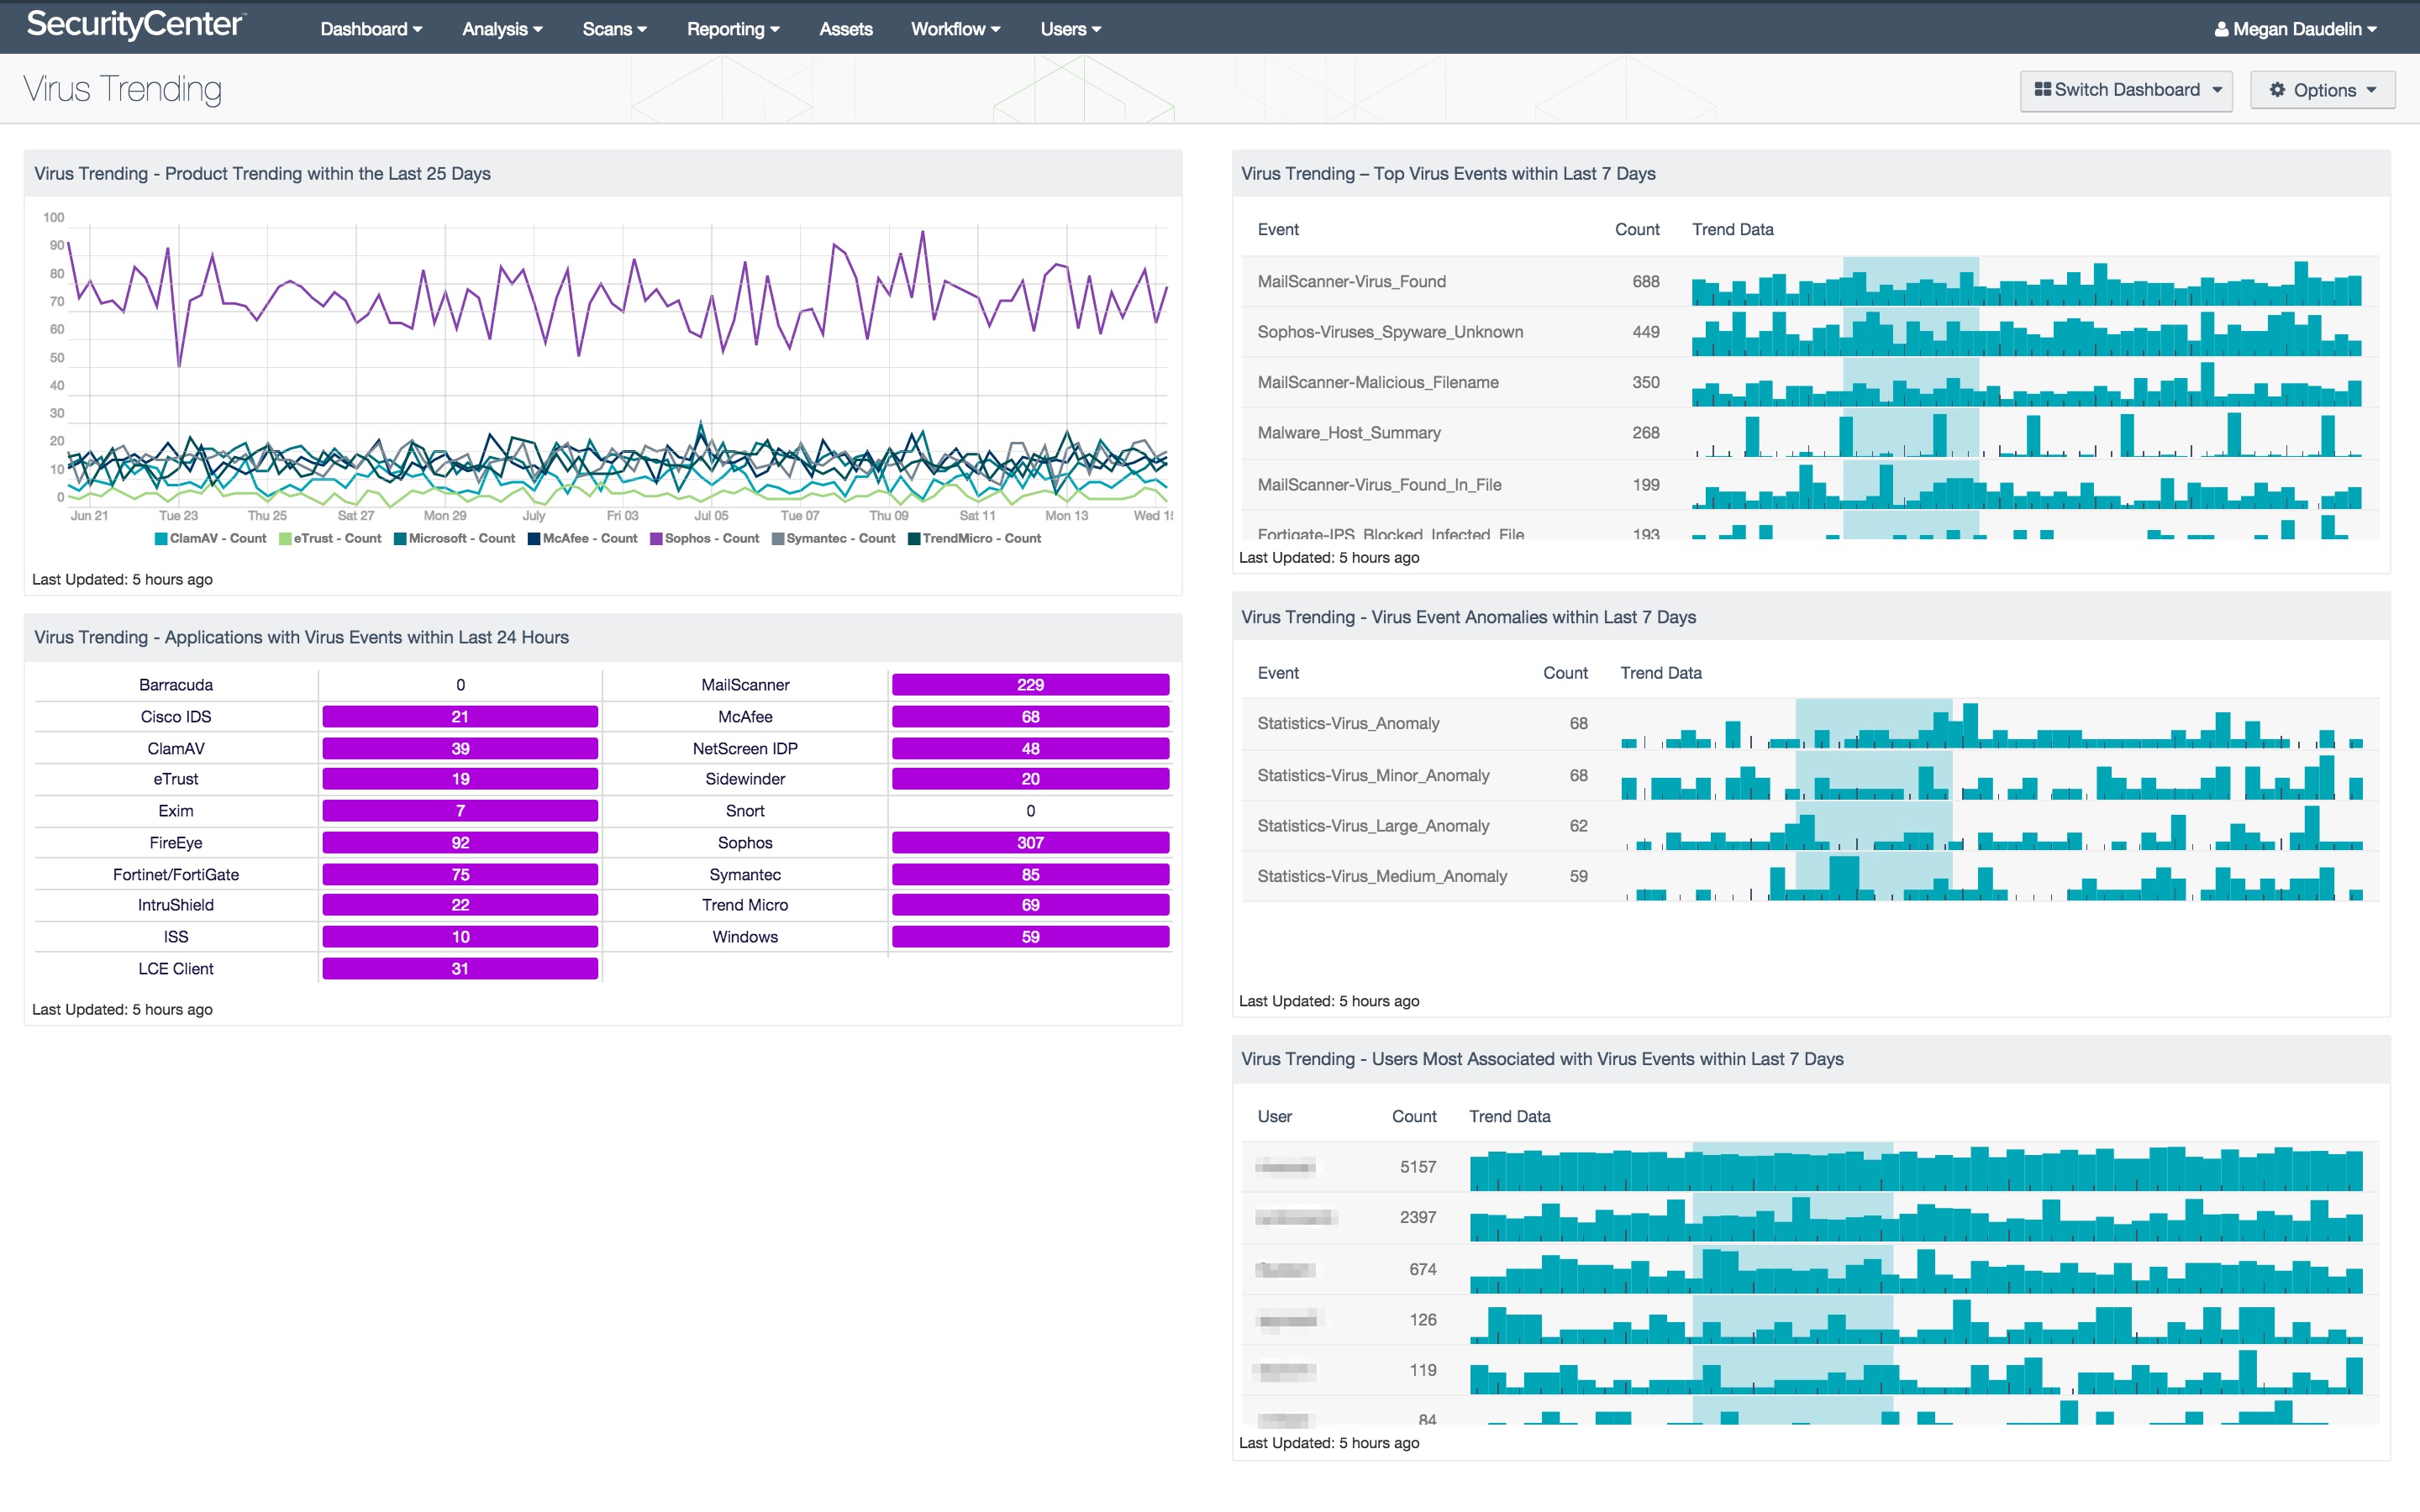
The components in the Virus Trending dashboard present data for virus activity and trending. This includes such information as 25-day trending of events from various antivirus products, 7-day trending of top virus events, 7-day trending of virus anomalies, users most associated with virus activity, and counts of virus events detected within the last 24 hours by various popular antivirus technologies. These components can help an organization to understand the virus activity on its network and provide insight into what may need further investigation.
The Virus Trending dashboard monitors virus-related activity on an organization’s network. By increasing visibility into the presence and growth of potentially malicious activity, faster incident response can be achieved. The trend data tells security teams where to focus their efforts in order to better protect their network. By knowing what threats have been most prolific, security teams can implement measures tailored to containing, removing, and mitigating them.
The dashboard also provides a view of user accounts associated with the most incidences of virus-related activity. This information can provide insight into determining which users may present a higher risk to the organization. Additionally, a depiction of the effectiveness and usefulness of the antivirus tools that are deployed throughout the organization are presented to the analyst. Together, these components can be used to determine which tools are working effectively, where holes still exist, and whether newly implemented tools are helping to close gaps in security.
The Log Correlation Engine (LCE) is the primary data source for this dashboard. The LCE is used specifically for correlating logs from across an organization’s network and alerting based on the “virus” normalized event type. These normalized events are then used in conjunction with the statistical anomaly and user IP address correlation features of the LCE to provide the data seen in the dashboard. The LCE models the statistical frequency of connections and events for each configured host and compares it to the history of that host over time. This process allows the LCE to identify and report statistical anomalies in a host’s behavior. The LCE performs user IP address correlation by processing authentication logs then associating the source IP address of each login with the related user account. Subsequent traffic generated from that IP address is then attributed to a specific user account.
The dashboard and its components are available in the SecurityCenter Feed, a comprehensive collection of dashboards, reports, assurance report cards and assets. The dashboard can be easily located in the SecurityCenter Feed under the category Threat Detection & Vulnerability Assessments.
The dashboard requirements are:
- SecurityCenter 5.0.0.1
- LCE 4.4.1
- LCE Client 4.4.0
SecurityCenter Continuous View (CV) provides continuous network monitoring, identifies vulnerabilities, helps reduce risk, and monitors for compliance. The Log Correlation Engine (LCE) performs deep log analysis and correlation to continuously discover and track users, applications, cloud infrastructure, trust relationships, and vulnerabilities. By integrating with antivirus vendors and other solutions, SecurityCenter CV provides the most comprehensive view of vulnerability data.
Listed below are the included components:
- Virus Trending - Product Trending Within Last 25 Days - This component displays trending of virus detections for various antivirus products within the last 25 days. Displayed are 7 of the most popular antivirus products in use by organizations today. This component can be modified to track any antivirus product that is used by an organization in their environment.
- Virus Trending - Applications with Virus Events Within Last 24 Hours - Displayed are counts of virus events detected within the last 24 hours by various antivirus technologies. The matrix displays two columns of products with their associated counts of virus events. A purple indicator means that events were detected in the last 24 hours. Clicking on the indicator will bring up the analysis screen, and setting the tool to Raw Syslog Events will display more detailed information.
- Virus Trending - Top Virus Events Within Last 7 Days - Displayed is trend data of normalized events from the “virus” event type that occurred within the last 7 days, along with their associated counts. The top 15 events with the highest counts are displayed. This component provides insight into the virus activity that is present on the network.
- Virus Trending - Virus Event Anomalies Within Last 7 Days - Trend data is displayed of statistical events indicating virus-related anomalies in the last 7 days, along with their associated counts and trend lines. Statistical anomalies are identified by the LCE based on a configured host’s behavior over time. Deviations from this behavior generate anomaly events. This component specifically displays the virus-related anomaly events. The top 15 events with the highest counts are displayed.
- Virus Trending - Users Most Associated with Virus Events Within Last 7 Days - Displayed is trend data for those users most associated with virus activity within the last 7 days, along with their associated event counts. The top 15 users with the highest event counts are displayed. This component provides insight into which users may be engaging in activity that exposes the network to viruses.