by Michael Willison
December 19, 2014

Often a Sophos analyst would like to know what type of Sophos events are occurring on the network. SecurityCenter can query the Log Correlation Engine (LCE) to discover which Sophos events were detected on the network. By performing these queries, an analyst can determine the type of activity that Sophos services are seeing on the network.
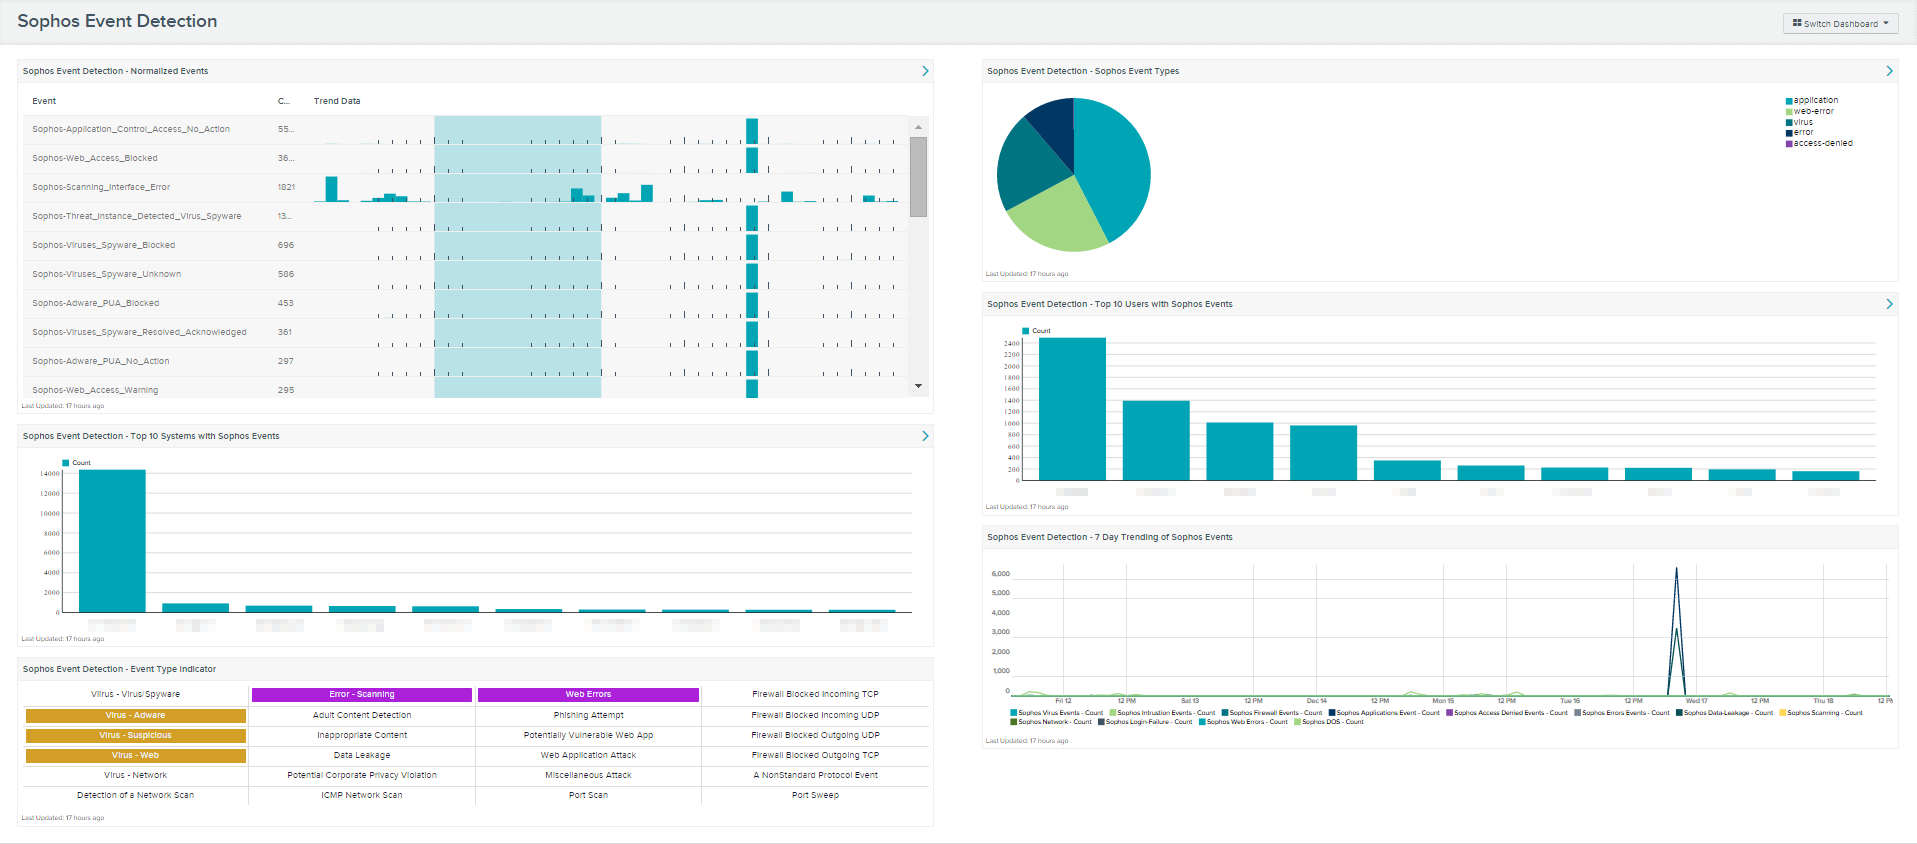
The components in this dashboard can help an analyst understand what Sophos events were generated over the last seven days. Using this dashboard, an analyst will be able to determine if Sophos is operating properly and what threats are being detected.
The dashboard and its components are available in the SecurityCenter Feed, a comprehensive collection of dashboards, reports, assurance report cards and assets. The dashboard can be easily located in the SecurityCenter Feed under the category Discovery & Detection.
The dashboard requirements are:
- SecurityCenter 4.7
- LCE 4.4.0
Establish true threat intelligence with Tenable’s SecurityCenter Continuous View (CV) and the Log Correlation Engine (LCE). SecurityCenter CV is the market leader in providing a unique combination of vulnerability detection, compliance auditing, and reporting. LCE provides deep packet inspection to continuously discover and track users, applications, cloud infrastructure, trust relationships, and vulnerabilities.
The following components are included in this collection:
- Sophos Event Detection - Normalized Events: This table displays the top 100 most common normalized Sophos events detected in the last seven days. Each row also displays the trending of the event over the last seven days. For more information on these events, the analyst can click on the browse component data icon (which looks like a little bar chart) in the upper right hand corner of the component.
- Sophos Event Detection - Sophos Event Types: Tenable LCE groups Sophos events into 13 categories. These are access-denied, application, compliance, data-leak, DOS, error, firewall, intrusion, login-failure, network, scanning, virus, and web-error. This pie chart displays the relative counts of Sophos events detected over the last seven days in each of these categories.
- Sophos Event Detection - Top 10 Systems with Sophos Events: This bar chart displays the top 10 systems with the most Sophos events over the last seven days. This chart will help an analyst determine what systems need to be investigated first. For more information on these events, the analyst can click on the browse component data icon (which looks like a little bar chart) in the upper right hand corner of the component.
- Sophos Event Detection - Top 10 Users with Sophos Events: This bar chart displays the top 10 users with the most Sophos events over the last seven days. There are many reasons why some users might have more Sophos events than others. For example users may keep canceling Sophos scans because they slow down their systems, Sophos end points can’t get updates, or there could be malware attempting to load on the systems. Understanding which users are generating the most Sophos events allows the organiztion to take appropriate actions.
- Sophos Event Detection - Event Type Indicators: This matrix component displays indicators for detections of 24 critical Sophos events over the past seven days. A purple indicator represents detection of informational type of Sophos events, a green indicator represents low impact events, an orange indicator represents medium impact events, and a red indicator represents high impact events.
- Sophos Event Detection - Seven Day Trending of Sophos Events: This component displays trend lines for Sophos events over a seven day period. Tenable LCE groups Sophos events into 13 categories. These are access-denied, application, compliance, data-leak, DOS, error, firewall, intrusion, login-failure, network, scanning, virus, and web-error. Each trend line represents one of these groupings. This trending chart will show an analyst if there were days with more activity than others.