by Cesar Navas
January 16, 2014

Continuous network monitoring is necessary because preventative measures alone will never be completely successful in stopping network attacks, intrusions, and compromise. But continuous monitoring generates a continuous flood of logs, records, and other data, which can be nearly impossible to manage and process, let alone find any evidence of suspicious activity in. Overwhelmed by the cascade of data and their inability to cope with the volume of information, organizations eventually just give up and ignore everything. Analysts may occasionally crack open this massive mountain of data for a quick, tentative peek when a network breach or other incident occurs – but by then, it's too late and the damage to the organization's critical systems, sensitive data, and reputation has already been done.
There is hope. Instead of reviewing all the data, reviewing certain critical logged data on a regular basis can be more manageable and more helpful. This information has the highest likelihood of identifying suspicious activity, with the lowest number of false positives. These logs, as noted in the SANS Top 6 Categories of Critical Log Information, can best indicate when suspect activity is occurring on the network.
The SANS Top 6 Categories are:
- Authentication and Authorization Reports
- Change Reports
- Network Activity Reports
- Resource Access Reports
- Malware Activity Reports
- Critical Errors and Failures Reports
As SANS notes, the noted logs may not always clearly indicate an intrusion, but will at least indicate that suspicious activity that needs further investigation has been detected.
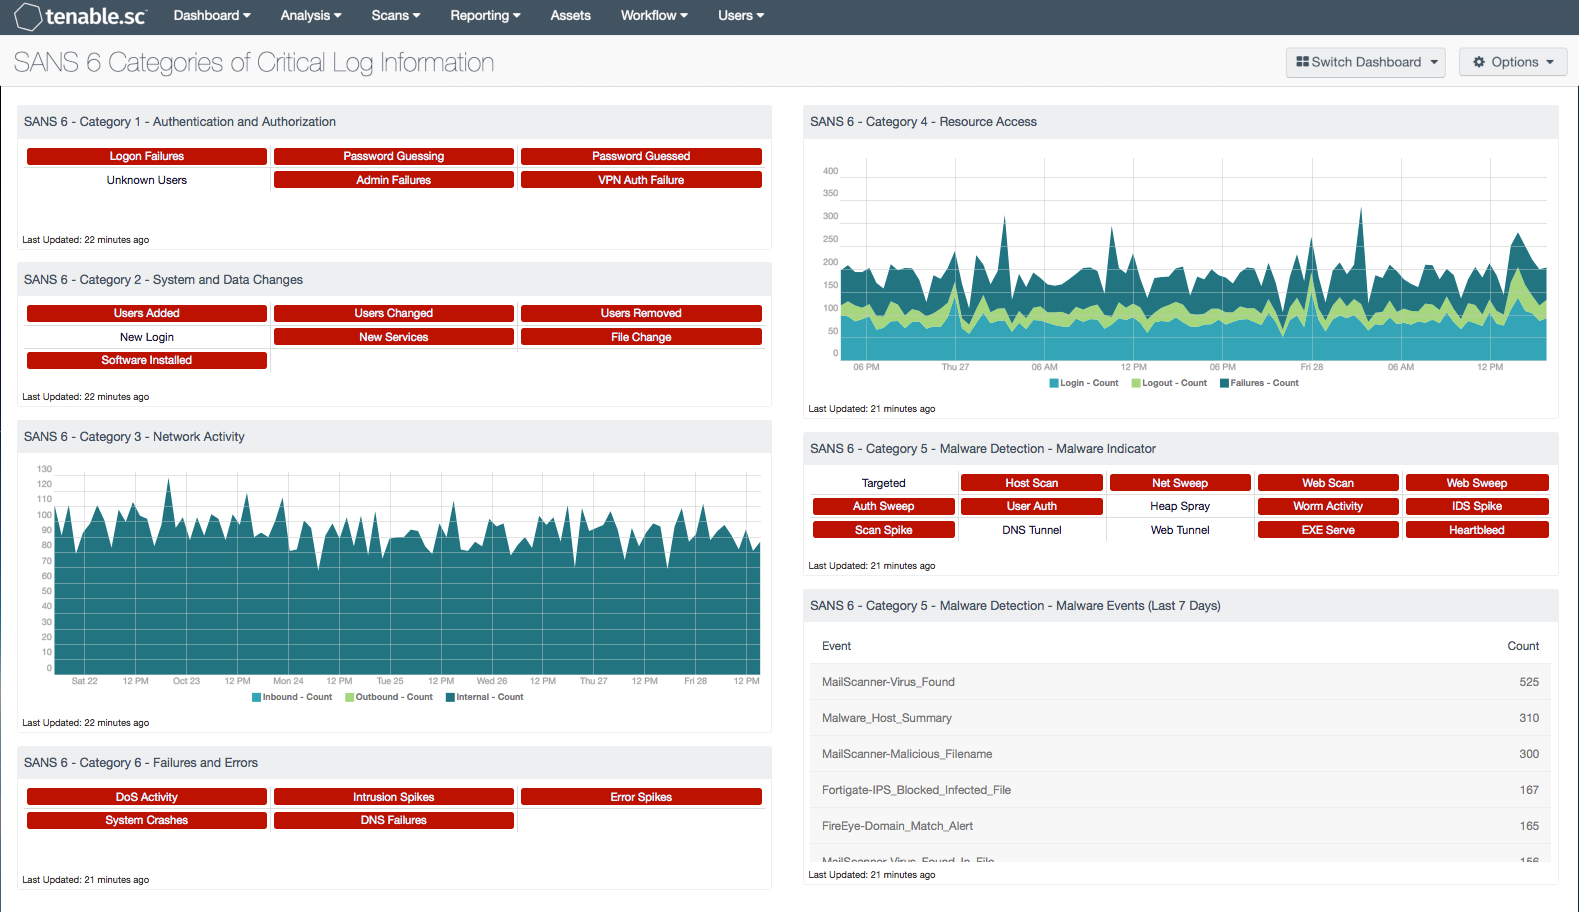
This dashboard presents events along with active and passive detections relevant to these categories in a series of indicator matrices, tables, and trending components. Analysts can use this dashboard to detect critical information, and easily drill down into the data presented to gain more detailed information. The components can be customized to fit organizational needs. The information on this dashboard will help the organization monitor the network and recognize suspicious activity that may need further investigation.
This dashboard is available in the Tenable.sc Feed, a comprehensive collection of dashboards, reports, Assurance Report Cards, and assets. The dashboard can be easily located in the Tenable.sc Feed under the category Security Industry Trends.
The dashboard requirements are:
- Tenable.sc 5.4
- Nessus 8.5.1
- NNM 5.9.1
- LCE 6.0.0
- Tenable Network Monitor
- Tenable NetFlow Monitor
Tenable's Tenable.sc Continuous View (CV) is the market-defining continuous network monitoring solution. Tenable.sc CV is continuously updated with information about advanced threats, zero-day vulnerabilities, and new regulatory compliance data. Active scanning periodically examines systems to find vulnerabilities, and can also make use of audit files to assess compliance. Passive listening provides real-time monitoring to collect information about systems and vulnerabilities. Host data and data from other security devices is monitored and correlated in order to detect abuse, anomalies, and network compromise. Tenable.sc CV provides an organization with the most comprehensive view of the network and the intelligence needed to monitor the network, and recognize and further investigate any suspicious activity.
The dashboard contains the following components:
SANS 6 - Category 1 - Authentication and Authorization: This indicator matrix identifies failed attempts at logins and authentication failures, as well as authentication guessing or guessed events.
SANS 6 - Category 2 - System and Data Changes: This indicator matrix alerts on various system and critical security changes to devices and networked assets.
SANS 6 - Category 3 - Network Activity: This component displays a seven-day trend analysis of network events. Observed application logs from the Tenable Passive Vulnerability Scanner, as well as logs from the Tenable NetFlow Monitor (TFM) and the Tenable Network Monitor (TNM), and other sources are logged to this event type. The trend is presented based on whether the events are inbound to, outbound from, or internal to the network.
SANS 6 - Category 4 - Resource Access: This component displays login and logout failures, and also provides a representation of login/logout activity over a defined time period.
SANS 6 - Category 5 - Malware Detection - Malware Indicator: This component takes many of the various detection technologies for botnets, malicious file hashes, anomalous network traffic, spikes in system logs and continuous scanning activity, and places them into one spot.
SANS 6 - Category 5 - Malware Detection - Malware Events: This component displays a summary of events of type "virus" that have occurred in the last seven days. These events were reported by various applications and collected by the Tenable Log Correlation Engine. For each event, a count of occurrences is shown.
SANS 6 - Category 6 - Failures and Errors: This component displays indicators for various network errors seen over the past 48 hours, such as DoS events, DNS failures, error spikes, system crashes, and intrusion spikes.