by Cesar Navas
July 1, 2016

The Payment Card Industry Security Standards Council (PCI SSC) maintains, evolves, and promotes Payment Card Industry standards for the safety of cardholder data across the globe. The PCI SSC provides organizations with technical and operational requirements for organizations accepting or processing payment transactions, and for software developers and manufacturers of applications and devices used in those transactions.
The Payment Card Industry Data Security Standard (PCI DSS) helps entities understand and implement standards for security policies, technologies, and ongoing processes that protect their payment systems from breaches and theft of cardholder data. The standards have historically been revised on a 2-3 year cycle, but the PCI SSC is transitioning to a posture of revising the PCI DSS as required based on changes to the current threat landscape. The current standard revision is PCI DSS Version 3.2 released in April 2016. Any organization that handles payment card information has to comply with the PCI DSS and must demonstrate compliance annually. Tenable's Tenable.sc Continuous View (CV) is able to help organizations monitor ongoing PCI DSS compliance by integrating with Tenable Nessus, Tenable Nessus Network Monitor (NNM), and Tenable Log Correlation Engine (LCE).
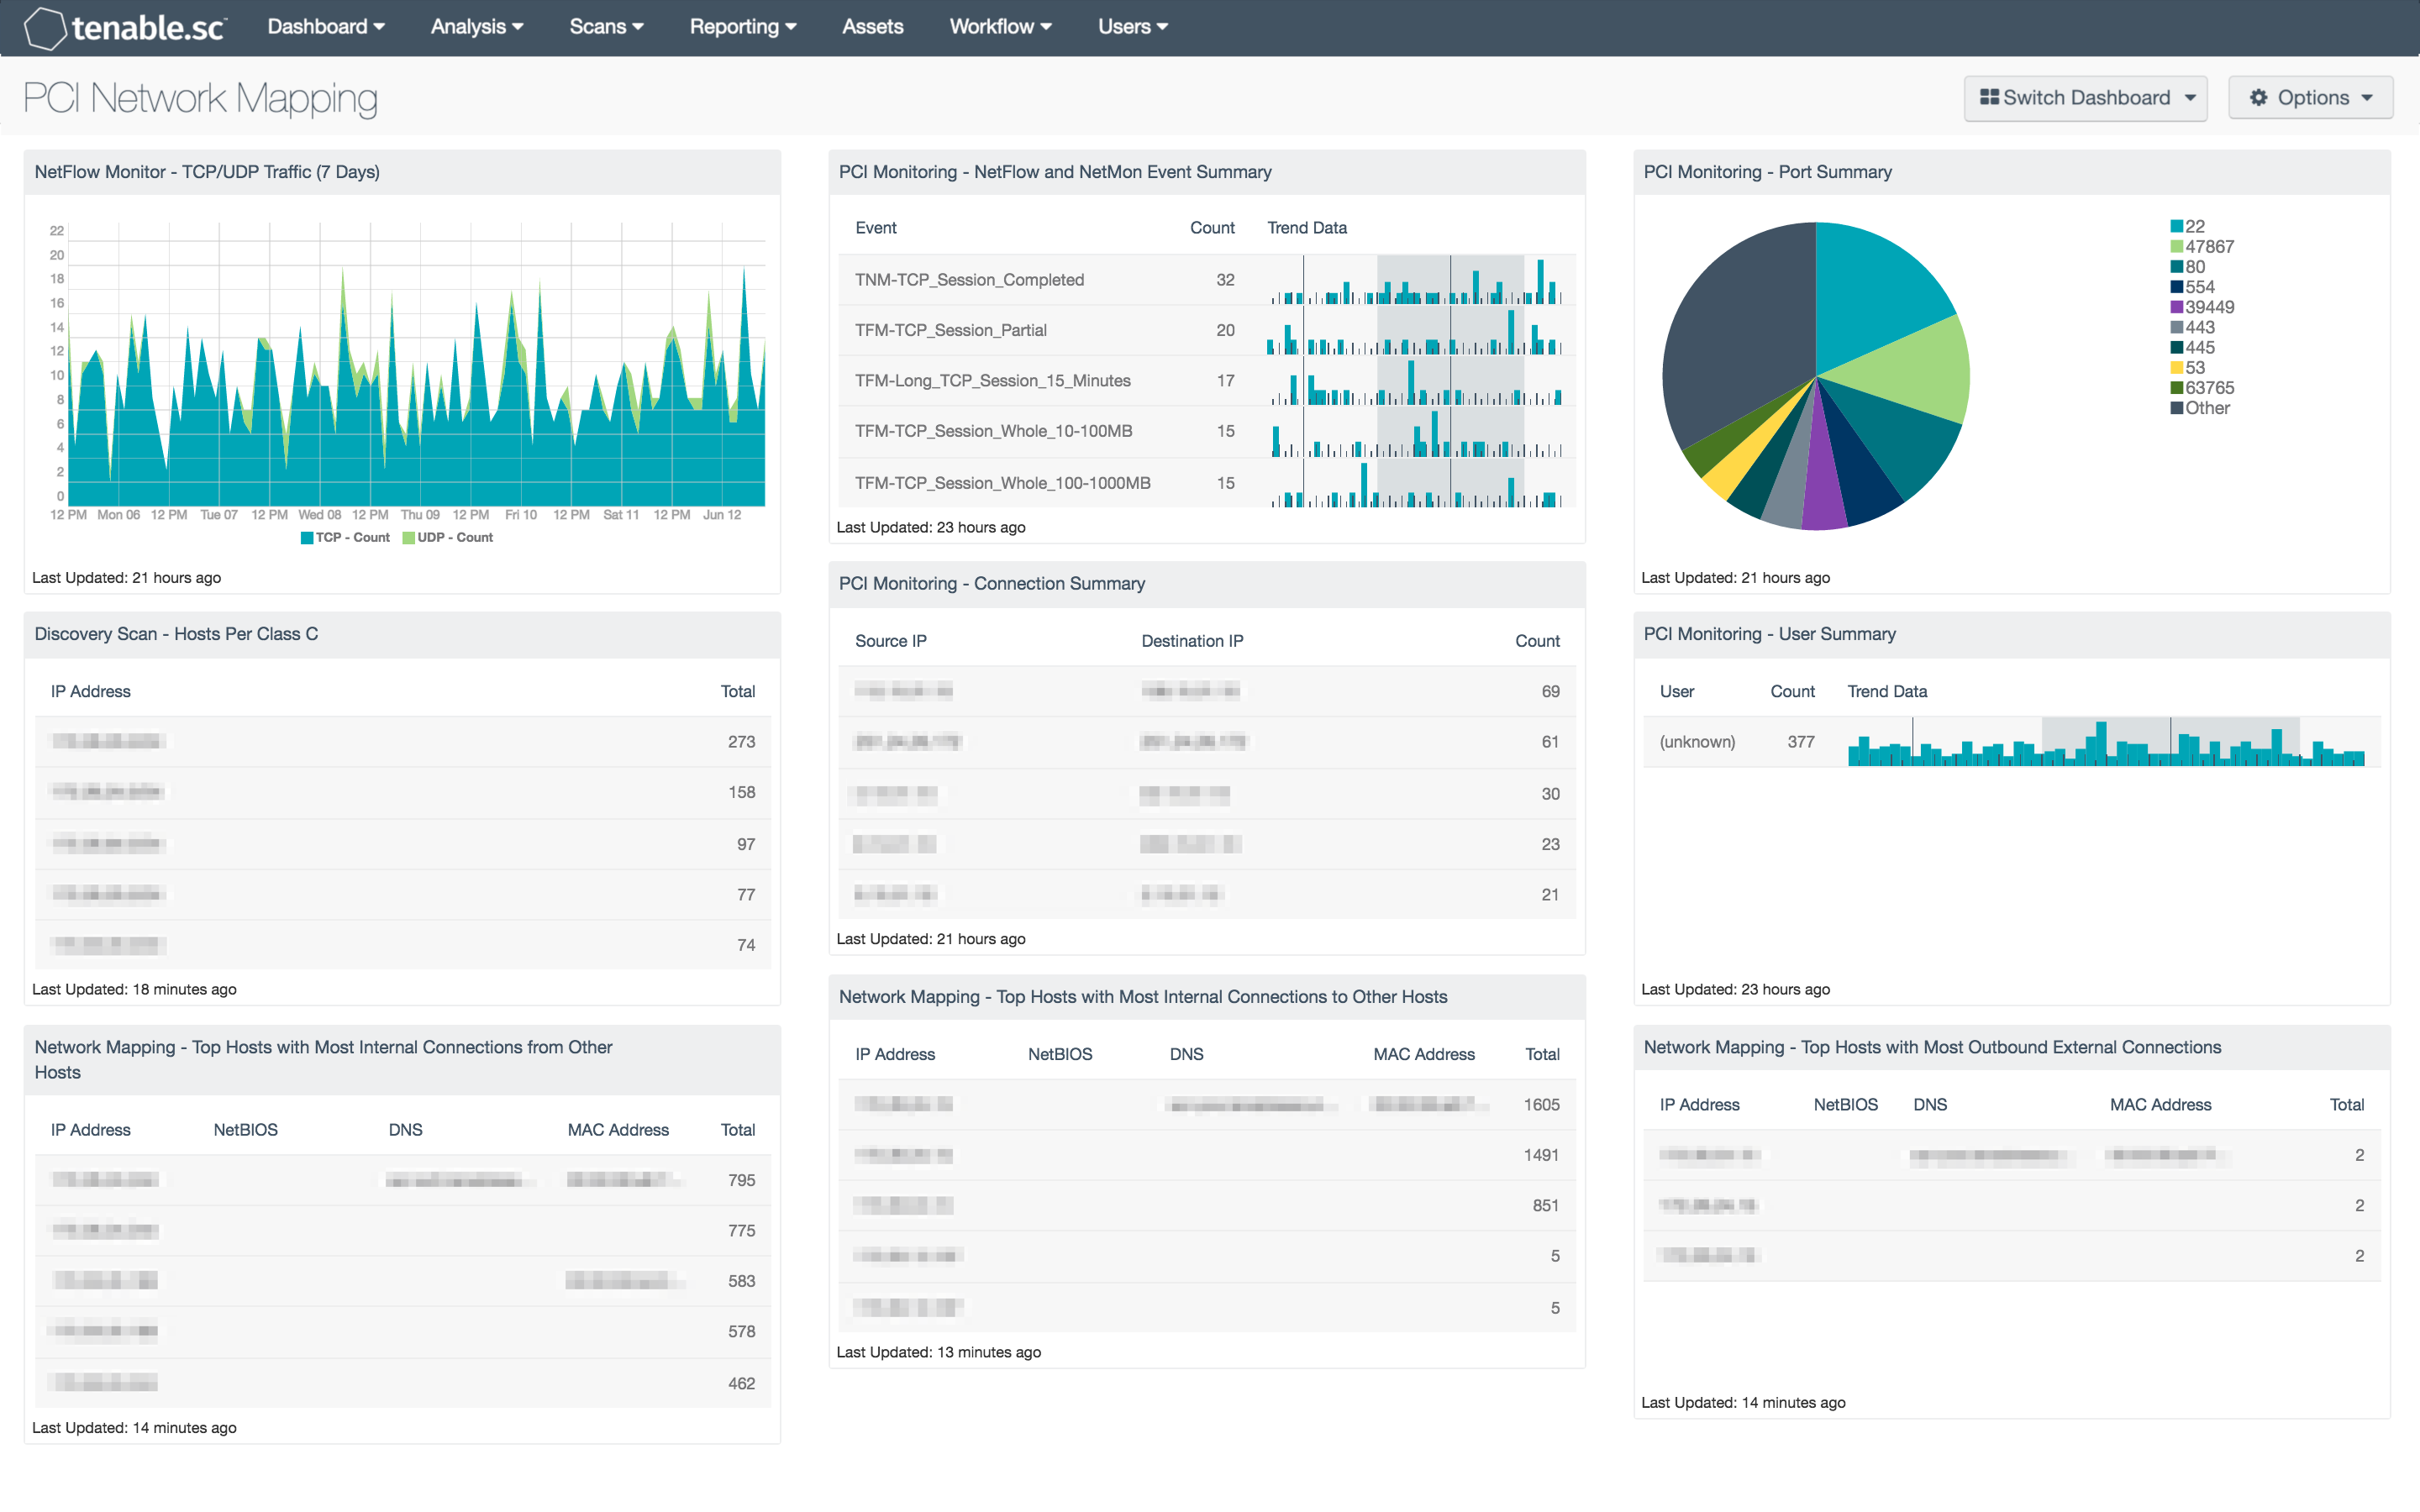
The PCI Network Mapping dashboard provides security teams with detailed insight into their network and cardholder data environment security posture. Event data is used to track trends in TCP and UDP traffic, as well as port usage and user activity. Data gathered by the Tenable NetFlow Monitor (TFM) and Tenable Network Monitor (TNM) is used to present event and connection summaries.
Tenable can monitor network connections not only from an internal perspective, but external connections as well. For internal connections, organizations can deploy NNM to passively monitor network activity. NNM can also be placed at the network boundary to capture external network traffic for analysis. Organizations can deploy LCE to systems in the organizations to collect and analyze information as well as have network devices direct syslog information to LCE. LCE correlates the information from all sensors to produce intelligent and actionable data. Analysts can see all of the data from LCE, NNM, and Nessus with a single “pane of glass” with Tenable.sc CV.
By effectively monitoring network traffic, security teams can better ensure network integrity and security. With this dashboard, organizations can assess their level of adherence with PCI DSS requirements focusing on awareness of network activity. The PCI requirements covered within components in this dashboard touch on the overall goal of requirements 1 and 2, “Build and maintain a secure network,” and by touching on requirements including 1.1.2, 1.1.4, 1.1.6, 1.2, 1.3, 1.4, 2.1, 2.2, and 2.4. Additionally, requirements 11.1.1, 12.2, 12.3, and 12.10.5 are also covered within this dashboard.
Organizations can configure repositories or asset lists in order to tailor the focus of the dashboard. When the dashboard is added from the Tenable.sc Feed, the appropriate assets, IP addresses, or repositories can be specified. Assigning one of the options to the dashboard will update all filters in the components. By creating static or combination asset lists that include all systems in the Cardholder Data Environment (CDE), each component can be filtered to display results directly related to ongoing PCI security. Using an asset list filter will also allow traffic into and out of the CDE to be monitored. In order to accurately measure an organization’s PCI security posture, asset lists need to be applied as filters to provide results focused on the CDE.
This dashboard is available in the Tenable.sc Feed, a comprehensive collection of dashboards, reports, Assurance Report Cards, and assets. The dashboard can be easily located in the Tenable.sc Feed under the category Compliance & Configuration Assessments. The dashboard requirements are:
- Tenable.sc 5.3.1
- Nessus 8.5.1
- NNM 5.9.0
- LCE 6.0.0
Tenable's Tenable.sc Continuous View (CV) provides continuous network monitoring, vulnerability identification, risk reduction, and compliance monitoring. Tenable.sc is continuously updated with information about advanced threats and zero-day vulnerabilities, and new types of regulatory compliance configuration audits. Tenable Nessus Network Monitor (NNM) performs deep packet inspection to enable discovery and assessment of operating systems, network devices, hypervisors, databases, tablets, phones, web servers, cloud applications, and critical infrastructure. Tenable Log Correlation Engine (LCE) performs deep log analysis and correlation to continuously discover and track systems, applications, cloud infrastructure, trust relationships, and vulnerabilities. By integrating with Nessus, NNM, and LCE, Tenable.sc CV’s continuous network monitoring is able to detect systems and vulnerabilities across the enterprise.
This dashboard contains the following components:
- NetFlow Monitor - TCP/UDP Traffic (7 Days): This component presents the analyst with a graphical representation and trending for TCP vs. UDP over the specified timeframe.
- Host Discovery - Hosts Per Class C: This table displays hosts detected across /24 network blocks using active scanning, passive listening, and host data.
- Network Mapping - Top Hosts with Most Internal Connections from Other Hosts: This table presents information on those hosts with the most passively detected internal connections from other hosts.
- PCI Monitoring - NetFlow and NetMon Event Summary: The “PCI Monitoring - NetFlow and NetMon Event Summary” table component lists the top 25 normalized events from Tenable NetFlow Monitor or Tenable Network Monitor.
- PCI Monitoring - Connection Summary: The “PCI Monitoring - Connection Summary” table component lists the top 25 connections detected in the network.
- Network Mapping - Top Hosts with Most Internal Connections to Other Hosts: This table presents information on those hosts with the most passively detected internal connections to other hosts.
- PCI Monitoring - Port Summary: The “PCI Monitoring - Port Summary” pie chart represents the top 10 network ports detected on the network.
- PCI Monitoring - User Summary: The “PCI Monitoring - User Summary” trend data component is used to display user summary information that was detected on the network.
- Network Mapping - Top Hosts with Most Outbound External Connections: This table presents information on those hosts with the most passively detected outbound external connections.