by Andrew Freeborn
January 11, 2016

Organizations have their defined process of remediating vulnerabilities within networks. Many times, organizations will remediate vulnerabilities with free and commercial software applications, scripts, and manual intervention. Depending on the size of the organization, automated software applications will remediate most vulnerabilities within an organization. Together, with automated methods and Tenable products, organizations can better secure and validate remediation efforts. The ease of use analysts gain from the fusion of Tenable products within an organization helps them to better detect and report on the status of vulnerabilities.
Remediating vulnerabilities is a continual part of any organization and requires complete remediation every time. Using this dashboard provides many benefits such as showing vulnerability remediation efforts. This dashboard displays the vulnerability remediation status of the current month’s remediation efforts along with the previous month’s efforts.
Scripts are another common method used to assist in vulnerability remediation efforts. Using scripts, analysts can help verify the vulnerability remediation completion efforts across an organization. However, scripts could have limitations and may not provide complete coverage of the environment to ensure accurate reporting of vulnerability remediation efforts. This dashboard can assist analysts to gain a more complete view of the vulnerability remediation efforts across an environment. Analysts can not only see the current month and previous month’s vulnerability remediation efforts, but also richer context of the vulnerabilities.
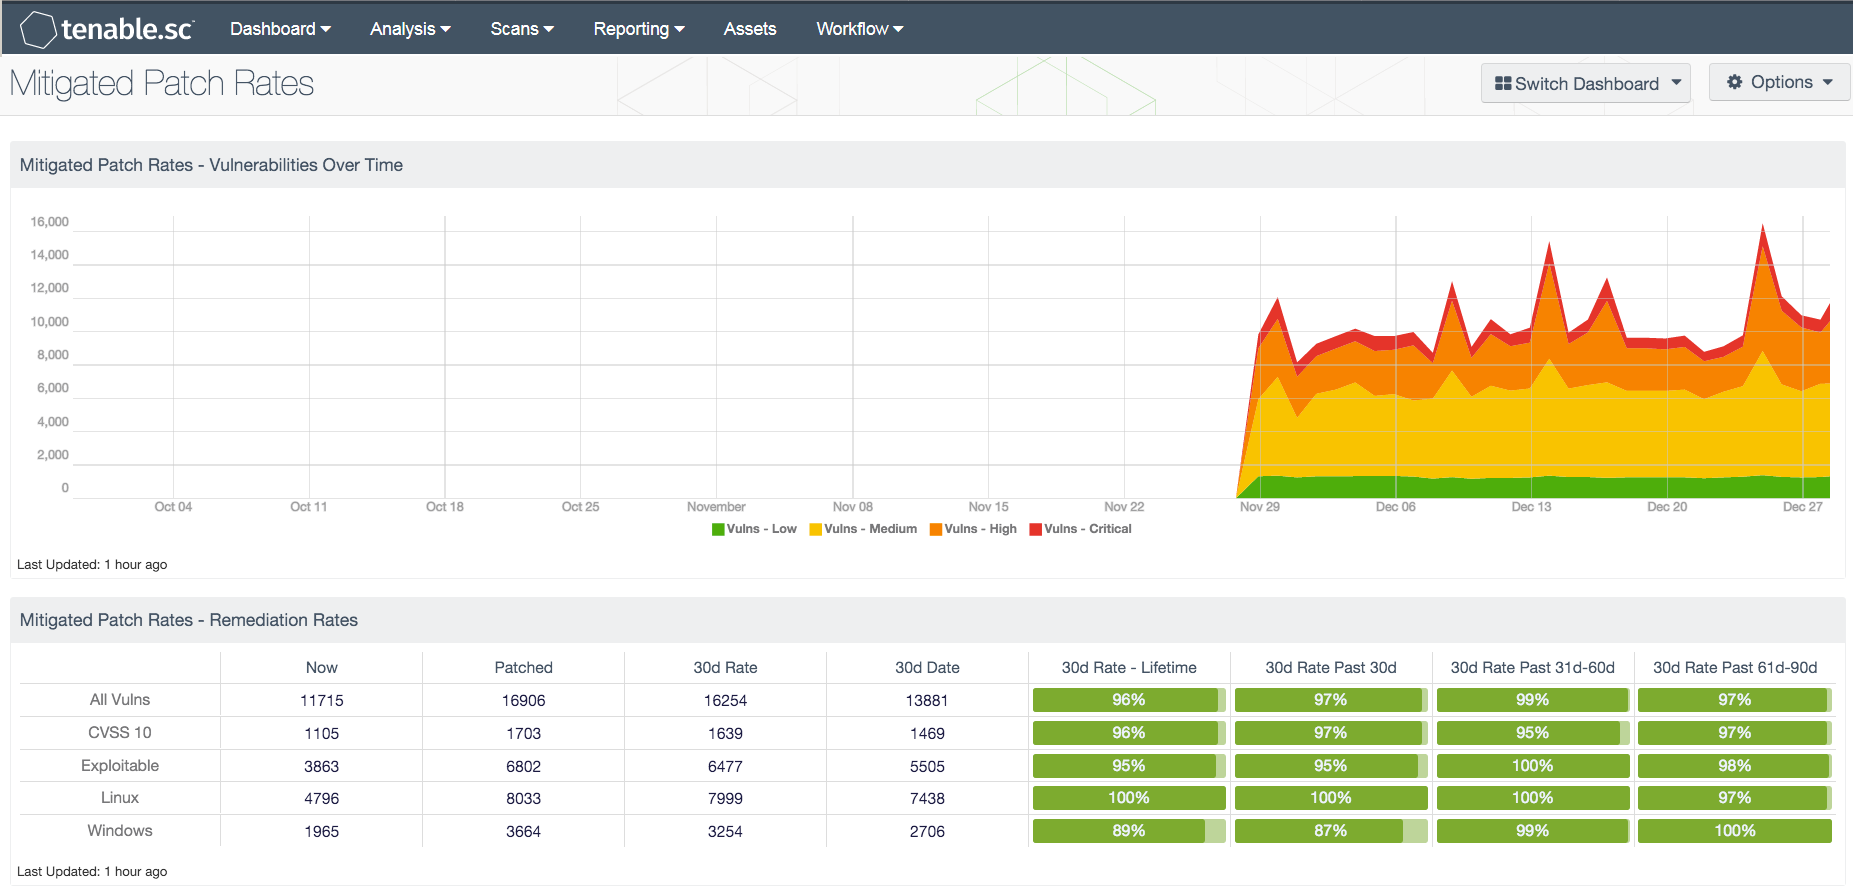
Having deeper context of the detected vulnerabilities in the environment helps analysts to better determine how to proceed with remediation efforts. Vulnerabilities have their own specific remediation plan, CVSS score, and many other attributes that need to be known to analysts. Within this dashboard, analysts can see a trend analysis of vulnerabilities present in the organization over time. This visual analysis helps to give a quick picture of the vulnerabilities and which vulnerability severity appears to be more prevalent in the organization. Analysts can use this analysis to help focus remediation efforts to reduce the risk in the environment.
Focused vulnerability remediation can assist organizations to quickly reduce the risk within the environment. A component within this dashboard displays totals of vulnerabilities matching certain characteristics. The total number of exploitable vulnerabilities within the organization that are currently present and previously remediated, along with remediation statistics over time are listed. Classifications such as operating system and a CVSS score of 10 are also shown in a similar fashion with this component.
The dashboard and its components are available in the Tenable.sc Feed, a comprehensive collection of dashboards, reports, Assurance Report Cards and assets. The dashboard can be easily located in the Tenable.sc Feed under the category Executive. The dashboard requirements are:
- Tenable.sc 4.8.2
- Nessus 8.5.1
Tenable provides continuous network monitoring to identify vulnerabilities, reduce risk and ensure compliance. Tenable.sc Continuous View (CV) includes Nessus, Nessus Network Monitor (NNM) and Log Correlation Engine (LCE). Tenable.sc CV performs log normalization from hundreds of unique data sources. Nessus is the global standard in detecting and assessing network data.
This dashboard contains the following components:
- Vulnerabilities Over Time: The area chart component displays vulnerabilities detected within the network over the last three months
- Remediation Rates: The matrix component displays vulnerabilities across categories of interest to analysts