Vulnerability management infrastructure itself becomes a critical attack surface when security tools remain unpatched, scanning coverage gaps persist undetected, or credential failures silently erode assessment quality. Organizations often focus exclusively on remediating vulnerabilities within business applications while overlooking the health of the security ecosystem responsible for discovering those exposures. The blind spot created when scanning agents fail to update or authentication mechanisms degrade introduces a dangerous asymmetry where defenders believe comprehensive assessment coverage exists when substantial portions of the environment operate without proper evaluation. The Tenable Vulnerability Management Dashboard solves this issue by providing centralized monitoring of scanning infrastructure health, authentication success rates, credential validation outcomes, and assessment coverage completeness to ensure vulnerability detection capabilities maintain operational effectiveness. This proactive approach transforms vulnerability management from a reactive patching exercise into a disciplined lifecycle management discipline grounded in verified scanning quality and comprehensive asset visibility.
Assessment depth varies dramatically across the enterprise based on whether scans leverage authenticated access, privileged credentials, or merely perform network-level reconnaissance without enumeration capabilities. Distinguishing between assets receiving comprehensive credentialed evaluation and those subjected only to limited discovery scans reveals the true scope of vulnerability visibility across the infrastructure. Temporal analysis tracking scanning patterns over 90-day periods exposes consistency trends, identifies periods of reduced coverage, and validates whether asset population growth remains proportional to scanning capacity expansion. Operating system fingerprinting accuracy directly impacts vulnerability correlation effectiveness, with low-confidence identifications indicating the need for enhanced credential deployment or policy configuration improvements. Scan duration patterns provide capacity planning intelligence by revealing performance outliers that may indicate inefficient plugin selections, network latency issues, or targets requiring extended enumeration periods.
Authentication failure patterns concentrate remediation attention on hosts experiencing recurring credential validation problems that prevent thorough vulnerability assessment. Diagnostic plugins reporting 23 distinct error conditions—spanning authentication failures, connection timeouts, insufficient privileges, and protocol restrictions—enable systematic troubleshooting rather than broad infrastructure interventions disconnected from actual failure modes. Aggregating scanning problems across the complete affected population quantifies the percentage of assets experiencing assessment impediments versus those achieving successful evaluation, establishing key performance indicators for program health measurement. Recent scan metadata filtered to 14-day windows ensures operational monitoring reflects current infrastructure performance rather than historical conditions no longer representative of present capability. Matrix visualizations correlate multiple quality dimensions simultaneously, revealing which assessments combine credentialed access, thorough plugin execution, and error-free completion versus those exhibiting deficiencies requiring investigation.
The gap between asset discovery and comprehensive vulnerability assessment represents a critical visibility deficiency where network-connected endpoints lack the authenticated evaluation necessary for accurate risk quantification. Assets observed within recent timeframes but subjected only to uncredentialed scanning methods reveal the scope of credential deployment initiatives required to achieve proper vulnerability enumeration. Scan information metadata validates that assessment execution complies with organizational standards for plugin coverage, safe check configurations, and credential utilization patterns defined in security policies. Licensing and discovery statistics track newly observed assets integrated into the vulnerability management program, ensuring coverage expands proportionally with infrastructure growth rather than allowing unassessed populations to accumulate. Stale asset identification surfaces endpoints not observed for extended periods, enabling age-out policies that prevent decommissioned systems from distorting reporting and consuming assessment resources.
Upstream scanning problems manifest through specific plugin detections indicating firewall interference, rate limiting, session concurrency restrictions, or misconfigurations preventing successful credential-based assessment. Scan duration segmentation across seven distinct time bands from 0-120 seconds through assessments exceeding 3600 seconds enables optimization of scheduling policies and capacity allocation to prevent extended-duration targets from impacting overall program cadence. Authentication status correlation between verification plugins and baseline scanning activities distinguishes coverage gaps requiring infrastructure intervention from credential failures necessitating identity management remediation. Risk acceptance workflow integration allows documentation of business justifications when applications must remain operational despite known vulnerabilities due to compatibility constraints, operational dependencies, or formal exception processes. Consolidated exposure intelligence eliminates duplicate scanning efforts by providing security teams with an authoritative source for vulnerability data grounded in verified assessment quality rather than assumptions about coverage completeness.
Exposure management maturity requires organizations to see scanning infrastructure health across multiple operational dimensions—authentication success rates, credential validation outcomes, assessment cadence adherence, and coverage completeness metrics. Predictive capacity planning leverages scan duration distributions, asset population growth trends, and authentication failure patterns to act proactively before degradation substantially compromises vulnerability detection effectiveness. Machine learning-enhanced anomaly detection helps predict what operational issues will emerge by identifying gradual drift in scanning regularity, fingerprinting confidence degradation, or expanding populations of unassessed assets requiring credential deployment. This unified vision consolidates infrastructure health signals into coherent operational intelligence, while unified insight connects scanning quality metrics with vulnerability detection confidence to validate that risk quantification reflects thorough assessment rather than incomplete evaluation, and unified action mobilizes coordinated response between security operations, infrastructure teams, and credential management personnel to address the systematic issues preventing comprehensive vulnerability visibility across the Organization.
Components:
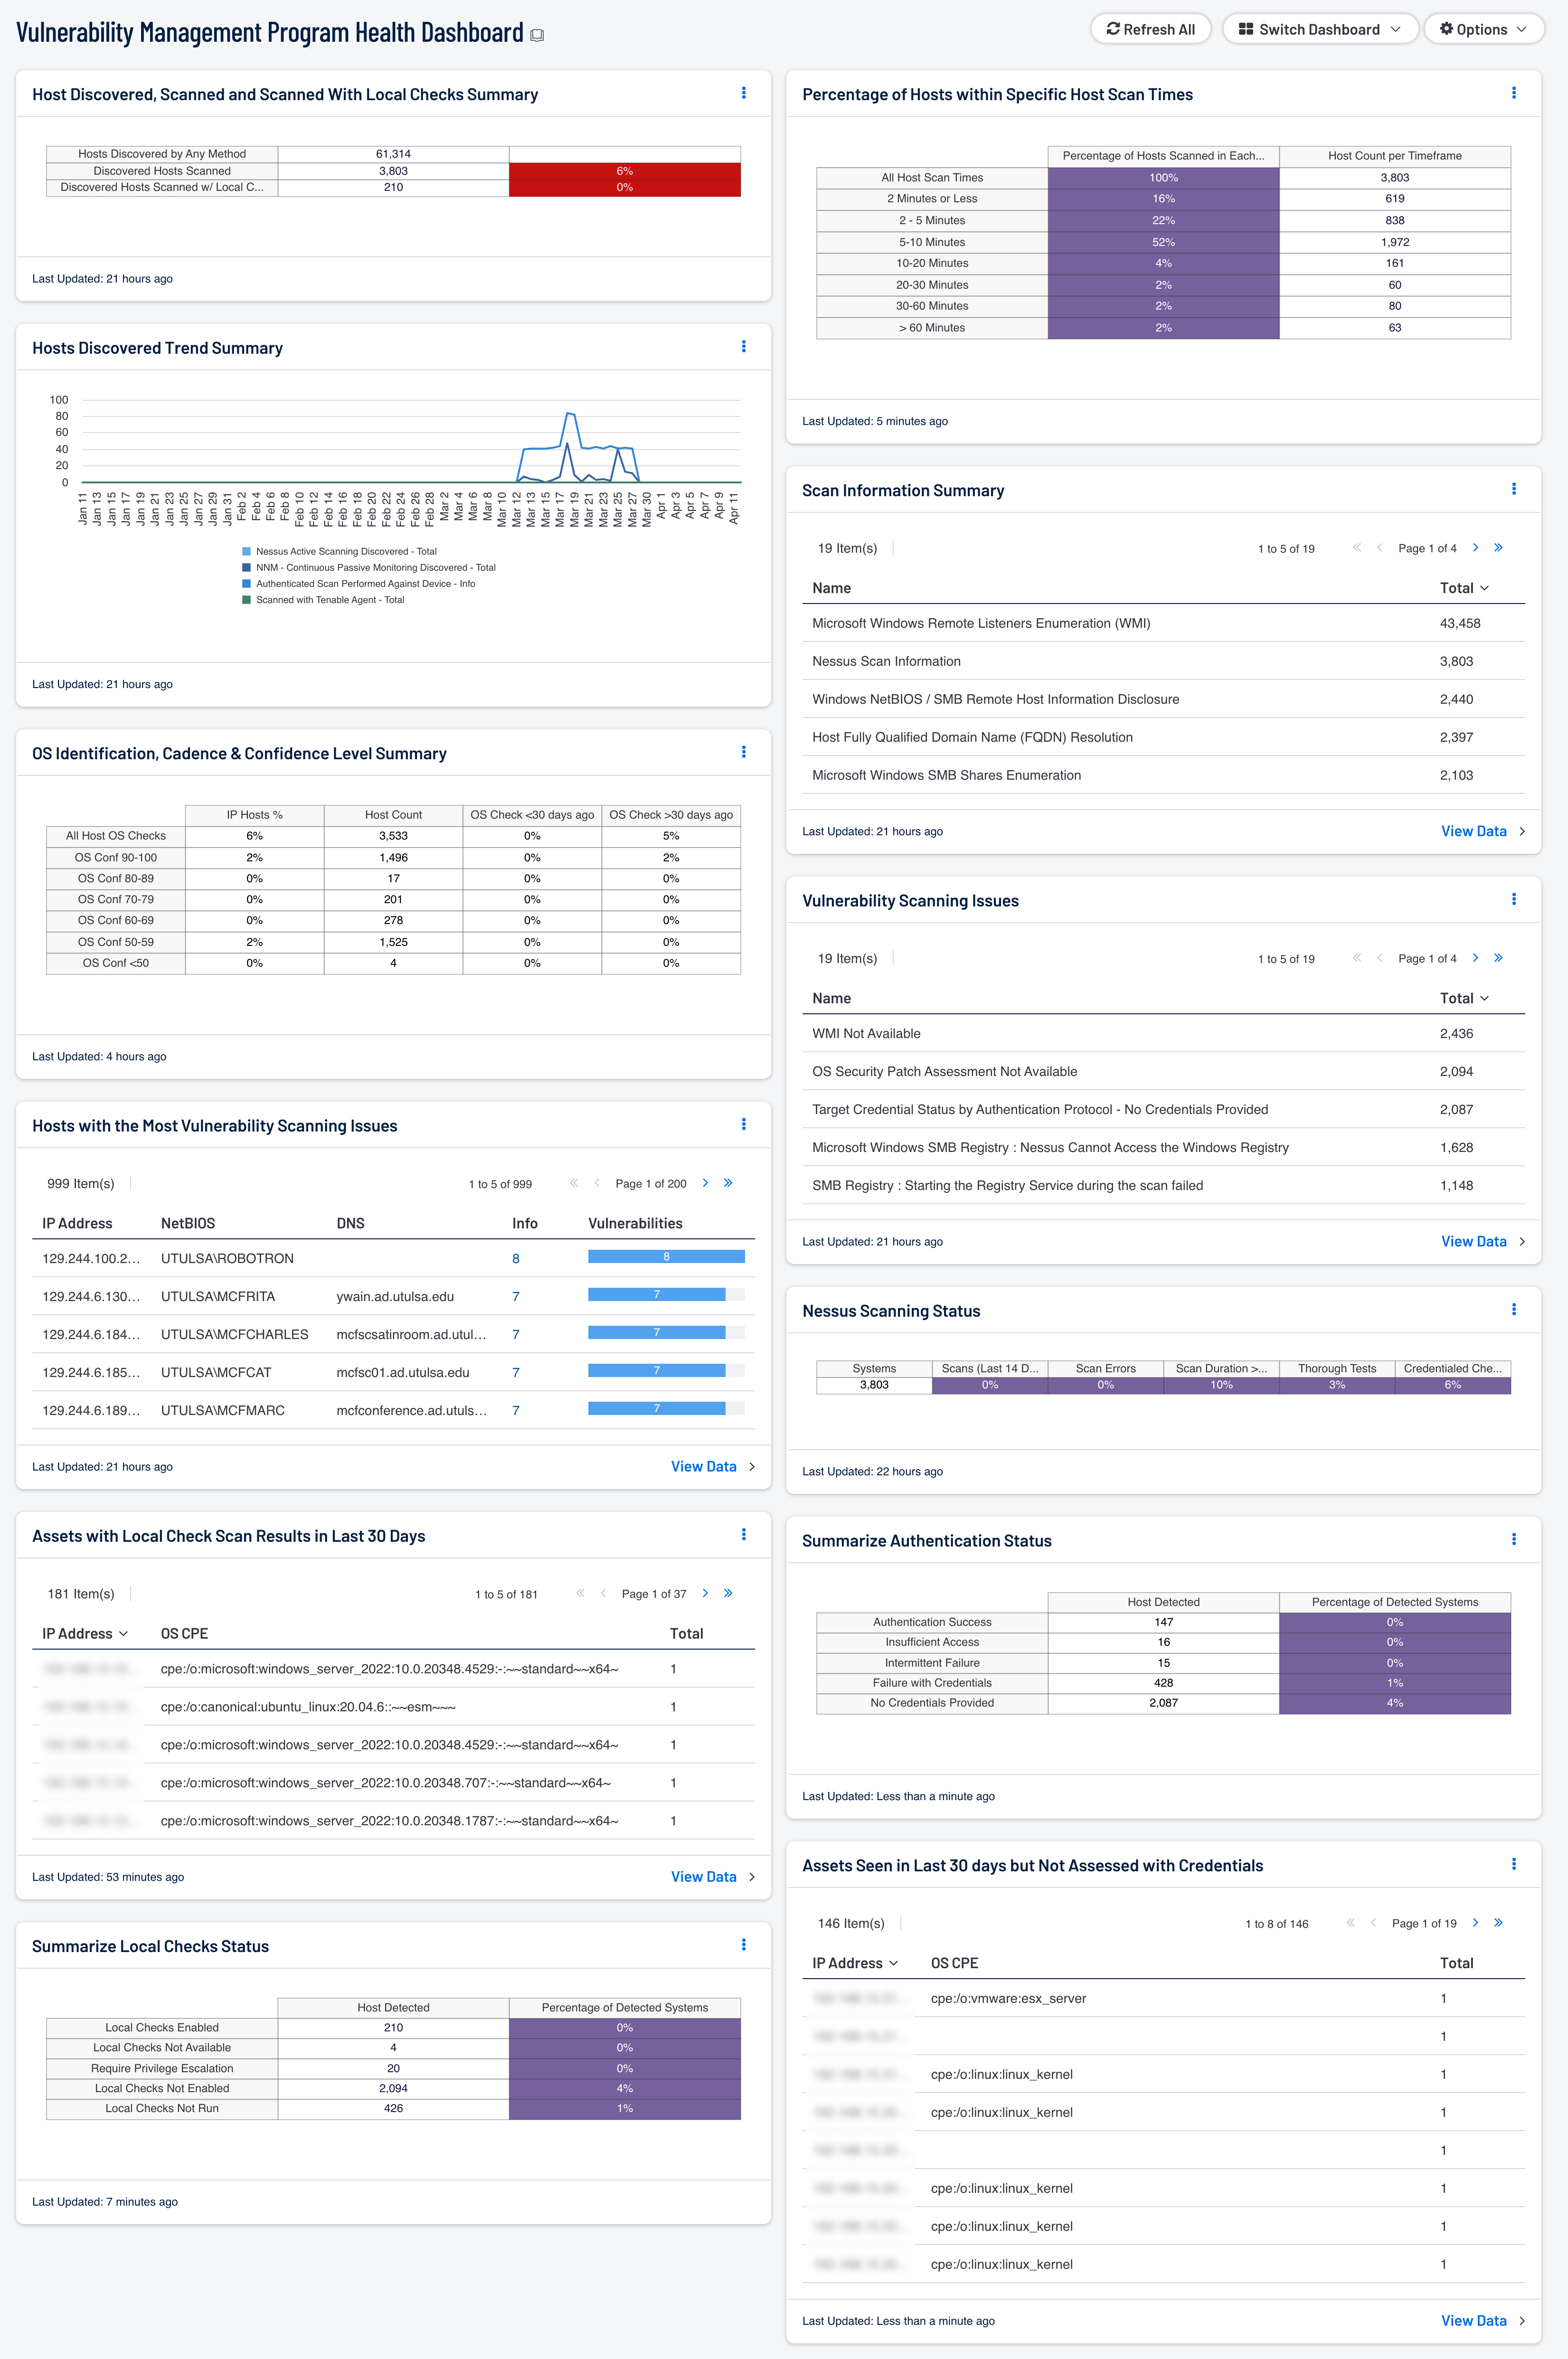
Track Host Discovered, Scanned and Scanned With Local Checks Summary: This matrix visualizes scanning depth across discovered assets, distinguishing between network-level discovery and credentialed scans. It tracks the progression from basic discovery to authenticated assessment, revealing gaps in comprehensive vulnerability coverage.
Hosts Discovered Trend Summary: This line chart tracks asset discovery patterns across multiple mechanisms over 90 days, combining passive, active, and credentialed scanning data. It reveals coverage consistency, scanning lapses, and asset population growth trends to support capacity planning.
OS Identification, Cadence & Confidence Level Summary: This matrix evaluates operating system fingerprinting accuracy with confidence scores ranging from 11-100%, segmented by assets seen within 30 days versus older identifications. It reveals OS identification gaps and low-confidence detections requiring enhanced scanning or credential deployment.
Hosts with the Most Vulnerability Scanning Issues: This table identifies assets with the highest occurrence of scanning problems by filtering 23 plugin IDs representing authentication failures, connection errors, and configuration issues. It prioritizes remediation efforts on hosts with the most severe scanning impediments, sorted by problem frequency.
Assets with Local Check Scan Results within 30 Days: This table inventories assets receiving credentialed scanning within the last 30 days, validating that scanning cadence meets organizational requirements. It enables calculation of the percentage of assets receiving authenticated assessment and supports compliance validation for regular vulnerability scanning requirements.
Summarize Local Checks Status: This matrix aggregates authentication verification results across multiple validation mechanisms, distinguishing scanning gaps from authentication failures. It reveals credential effectiveness patterns and enables root cause analysis for credential versus infrastructure issues.
Percentage of Hosts within Specific Host Scan Times: This matrix analyzes scan duration patterns across seven time bands (0-120 seconds to 3600+ seconds), identifying performance outliers and inefficiencies. It supports scanning efficiency analysis, capacity planning, and optimization of scan schedules for extended-duration assets.
Scan Information Summary: This table presents detailed scanning metadata from 25 informational plugins, reporting scan configurations, methodologies, credential utilization, and assessment thoroughness. It validates scanning compliance with organizational standards and supports audit requirements.
Vulnerability Scanning Issues: This table consolidates all hosts experiencing scanning problems using the same 23-plugin filter set, presenting the complete affected population. It provides comprehensive visibility into every asset with authentication failures, connection errors, or configuration impediments for systematic remediation planning.
Nessus Scanning Status: This matrix monitors scanning infrastructure health across multiple quality dimensions: recency (14 days), error conditions, scan duration, thorough test execution, and credentialed check success. It distinguishes high-quality comprehensive scans from incomplete or problematic assessments, providing early warning of scanning degradation.
Summarize Authentication Status: This matrix correlates authentication verification plugins with baseline scanning plugins to create a comprehensive view of credential validation outcomes. It distinguishes successful authentication from credential failures or insufficient privileges, enabling targeted credential management improvements and tracking authentication success rates.
Assets Seen in Last 30 days but Not Assessed by Vulnerability Management: This table identifies the gap between asset visibility and vulnerability assessment, exposing hosts seen within 30 days with uncredentialed scans only. It reveals assets requiring credential deployment to achieve comprehensive vulnerability assessment and supports targeted remediation planning.
Tenable One
Request a demo
The world’s leading AI-powered exposure management platform.
Thank You
Thank you for your interest in Tenable One.
A representative will be in touch soon.
Form ID: 7469
Form Name: one-eval
Form Class: c-form form-panel__global-form c-form--mkto js-mkto-no-css js-form-hanging-label c-form--hide-comments
Form Wrapper ID: one-eval-form-wrapper
Confirmation Class: one-eval-confirmform-modal
Simulate Success